
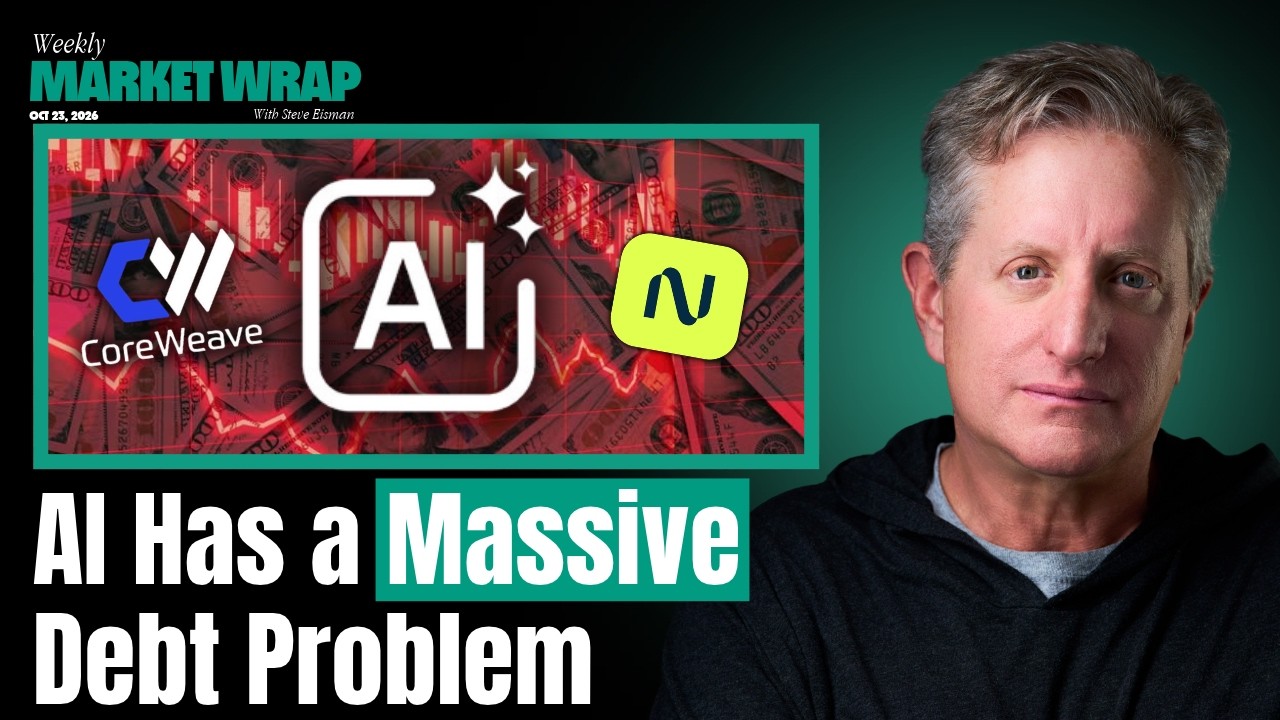
AI Narrative Switched, Debt Yields Spike | The Weekly Wrap
CoreWeave’s rising debt yields and fading confidence in AI data-center economics frame a weekly review of Meta, Tesla, SpaceX, Netflix, French bonds and housing.
CoreWeave’s rising debt yields and fading confidence in AI data-center economics frame a weekly review of Meta, Tesla, SpaceX, Netflix, French bonds and housing.
Could’ve bought the 7.2% $PSA preferred with half of the money at the peak The annual dividend would be $1.0 mm which would be about $362k more than the current balance $1 mm per yr forever https://t.co/S4Erg9tZYf
*INSTACART EXPLORING A SALE: INFORMATION Sale could value $CART at $16 - $17B and they've had preliminary talks with $DASH and $UBER
$HAWK came public with MS and GS at the peak of the $PL and $SPCX space pump cycle. Investors likely bought the stock blindly without really understanding the business. Alas, the shareholder base is now transitioning into strong hands. I think those buyers will be rewarded.
BMO on $CENX: “Discussions centered on tariff uncertainty, Oklahoma smelter progress, current operations, improving free cash flow conversion & Hawesville monetization. Meanwhile, with CENX trading at 2.5x current spot-based EBITDA, valuation is compelling in our view.” 2.5X! https://t.co/3jKwcyjheE
Philip Morris reported Q3 growth across heated tobacco, combustibles and e-vapor in Europe while gaining U.S. nicotine-pouch share.
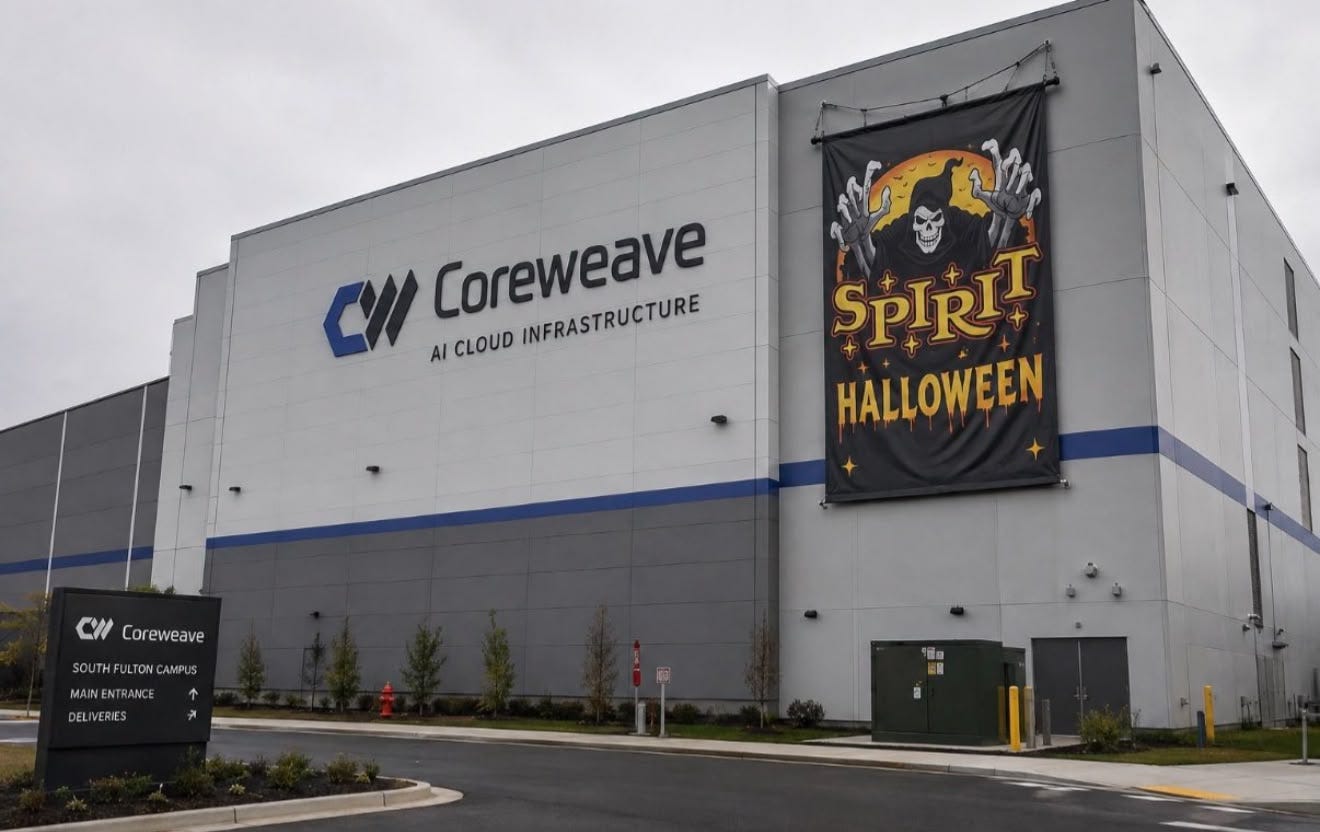
CoreWeave’s $35 billion to $39 billion 2026 spending plan relies on debt as unsecured yields reach 15%, making its GPU cloud expansion a…
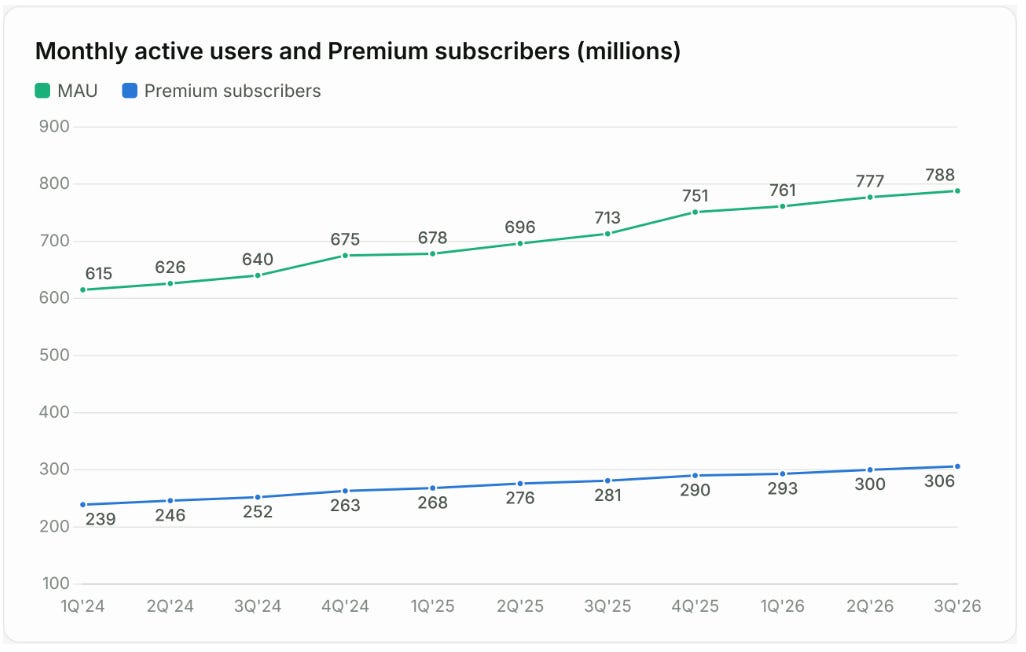
Spotify's third-quarter results met or exceeded guidance, with 306 million Premium subscribers and €672 million operating income, while…
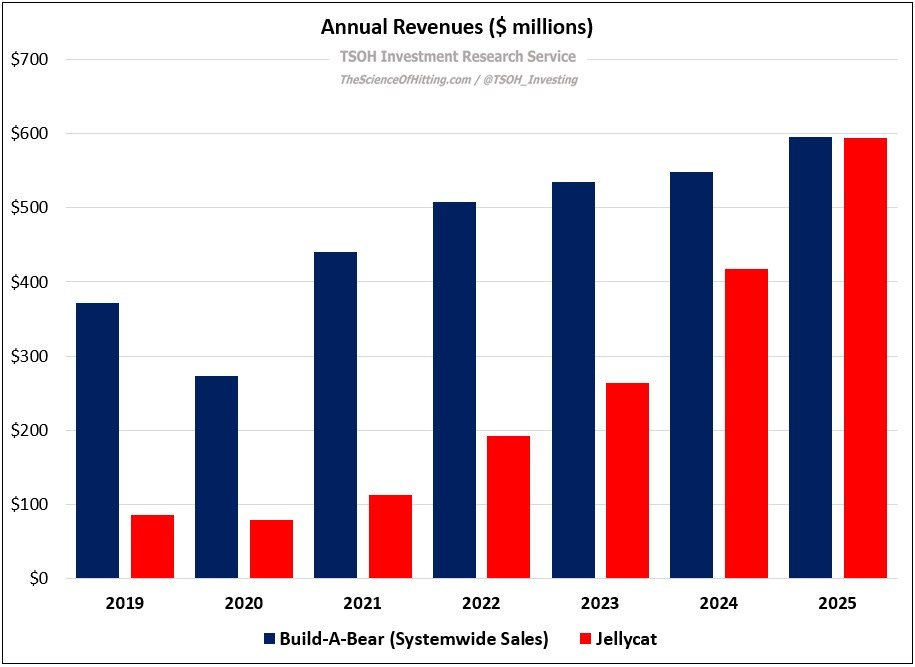
TSOH Weekly Roundup covers Ally’s improving credit and capital returns, Pepsi’s weak beverage brands, and Match Group’s plan to revive…
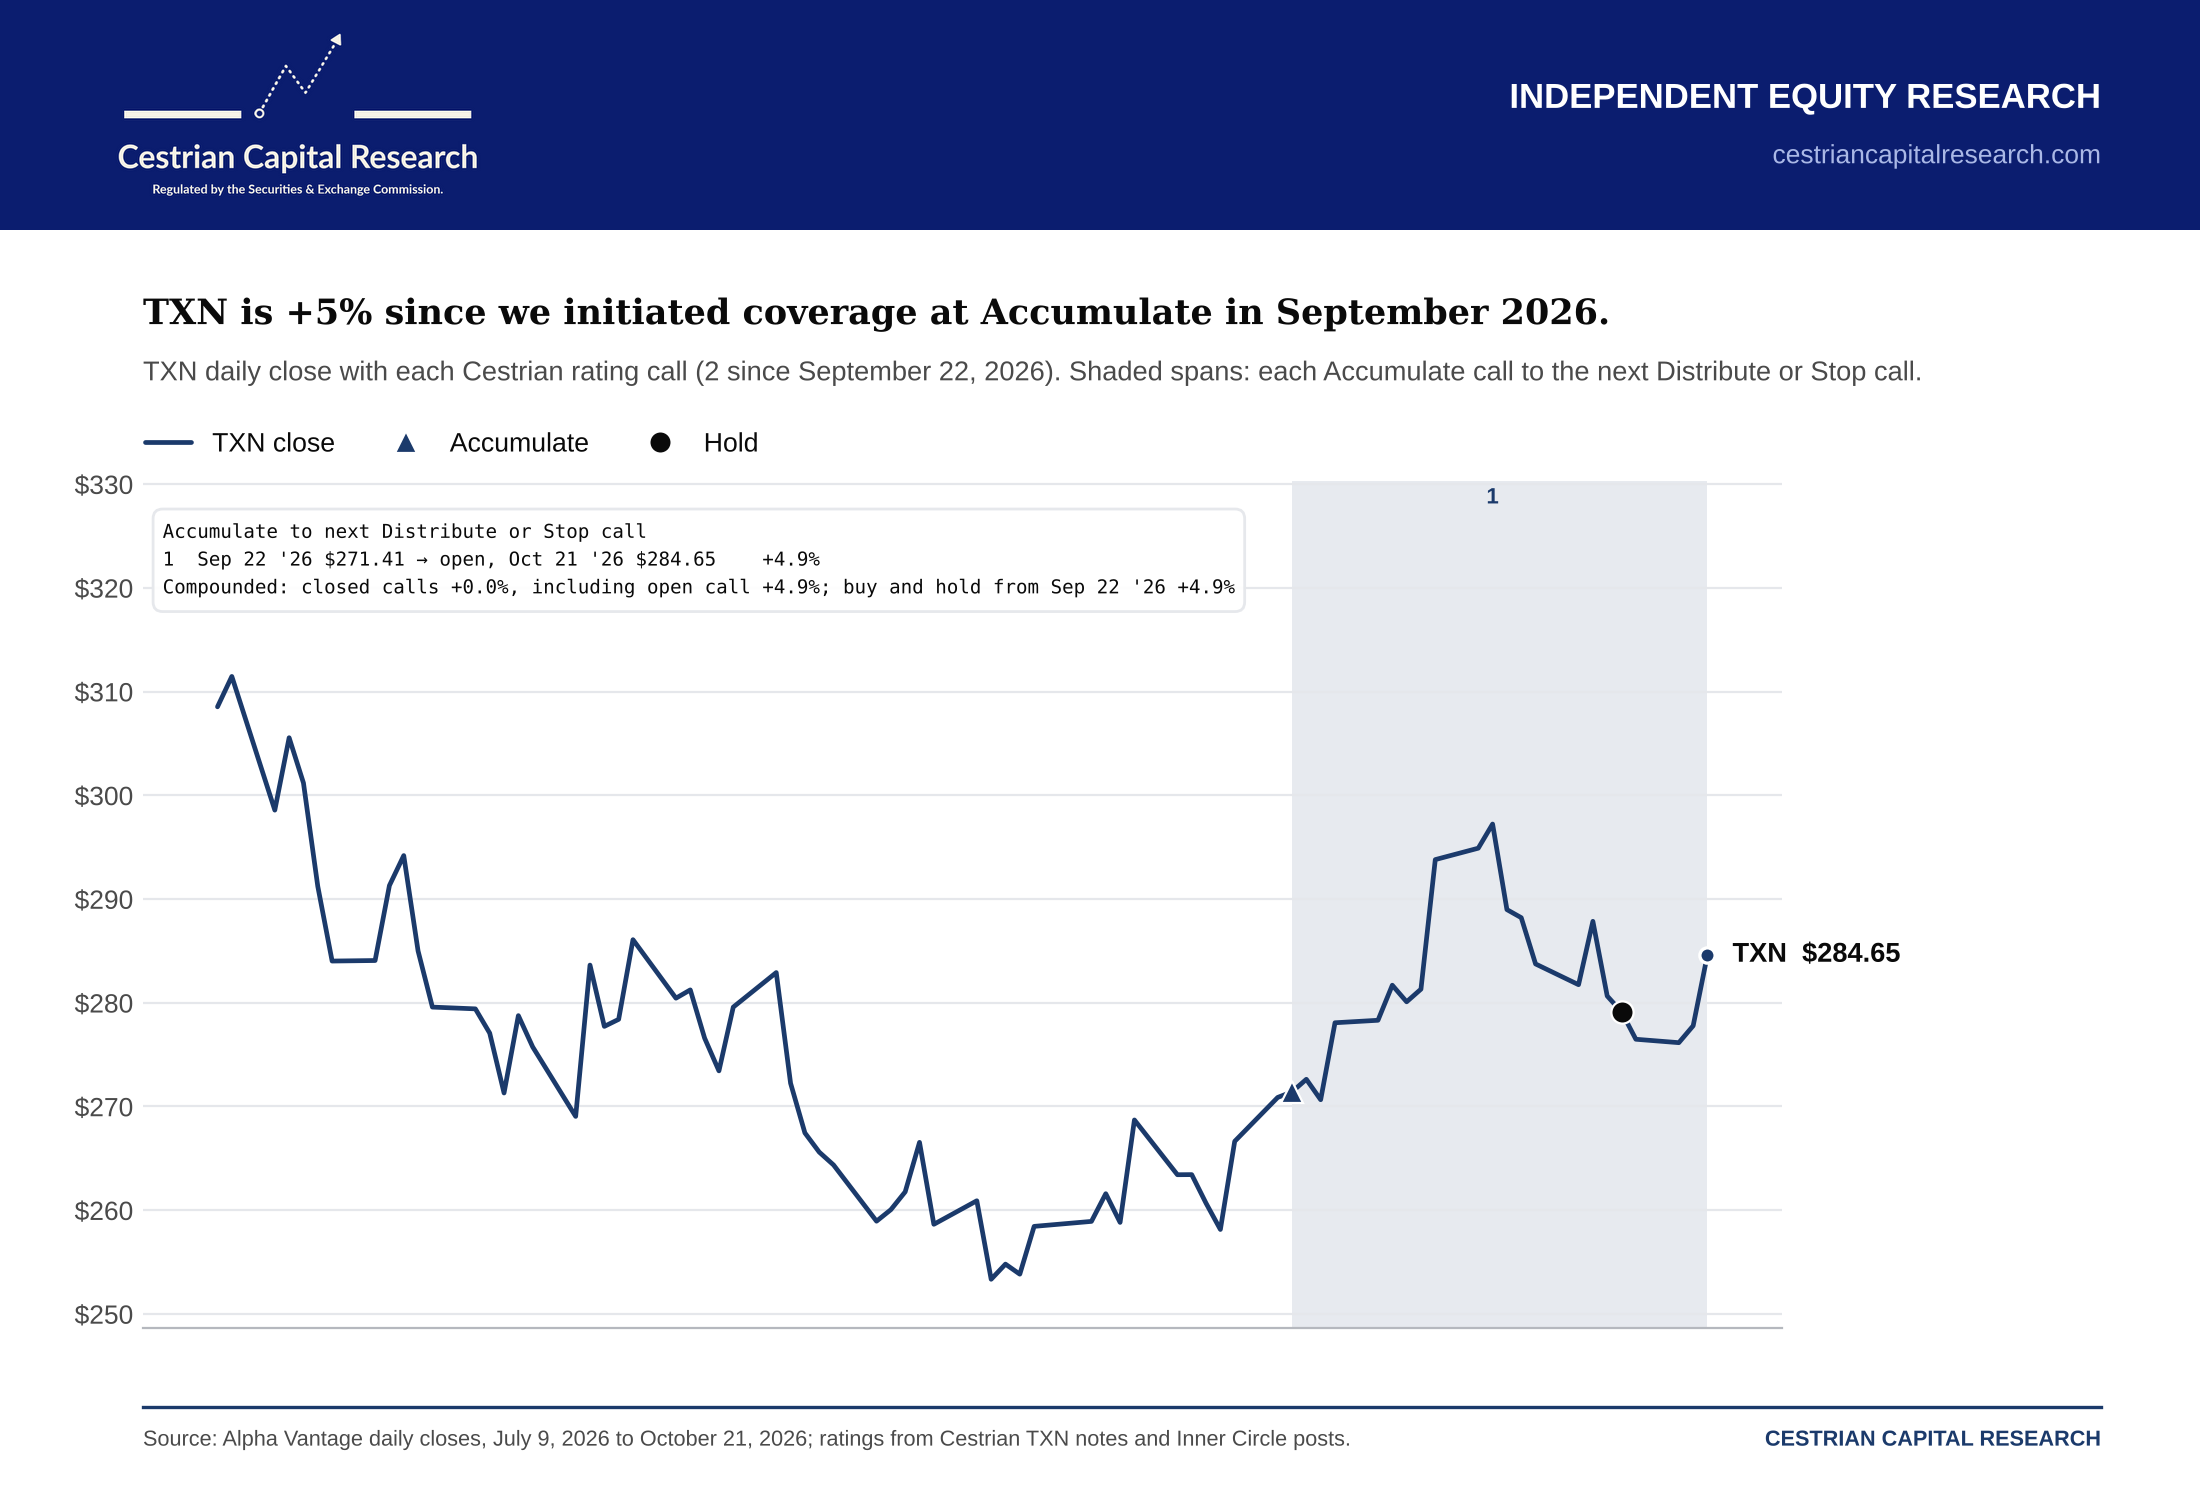
Texas Instruments reported Q3 revenue of $6.06 billion, up 28%, with 47% operating margin and Q4 guidance above seasonal norms; Cestrian…


Medpace authorized $1 billion of buybacks through 2028 after Q3 revenue rose 8.5% to $716 million; service revenue grew roughly 12% as…
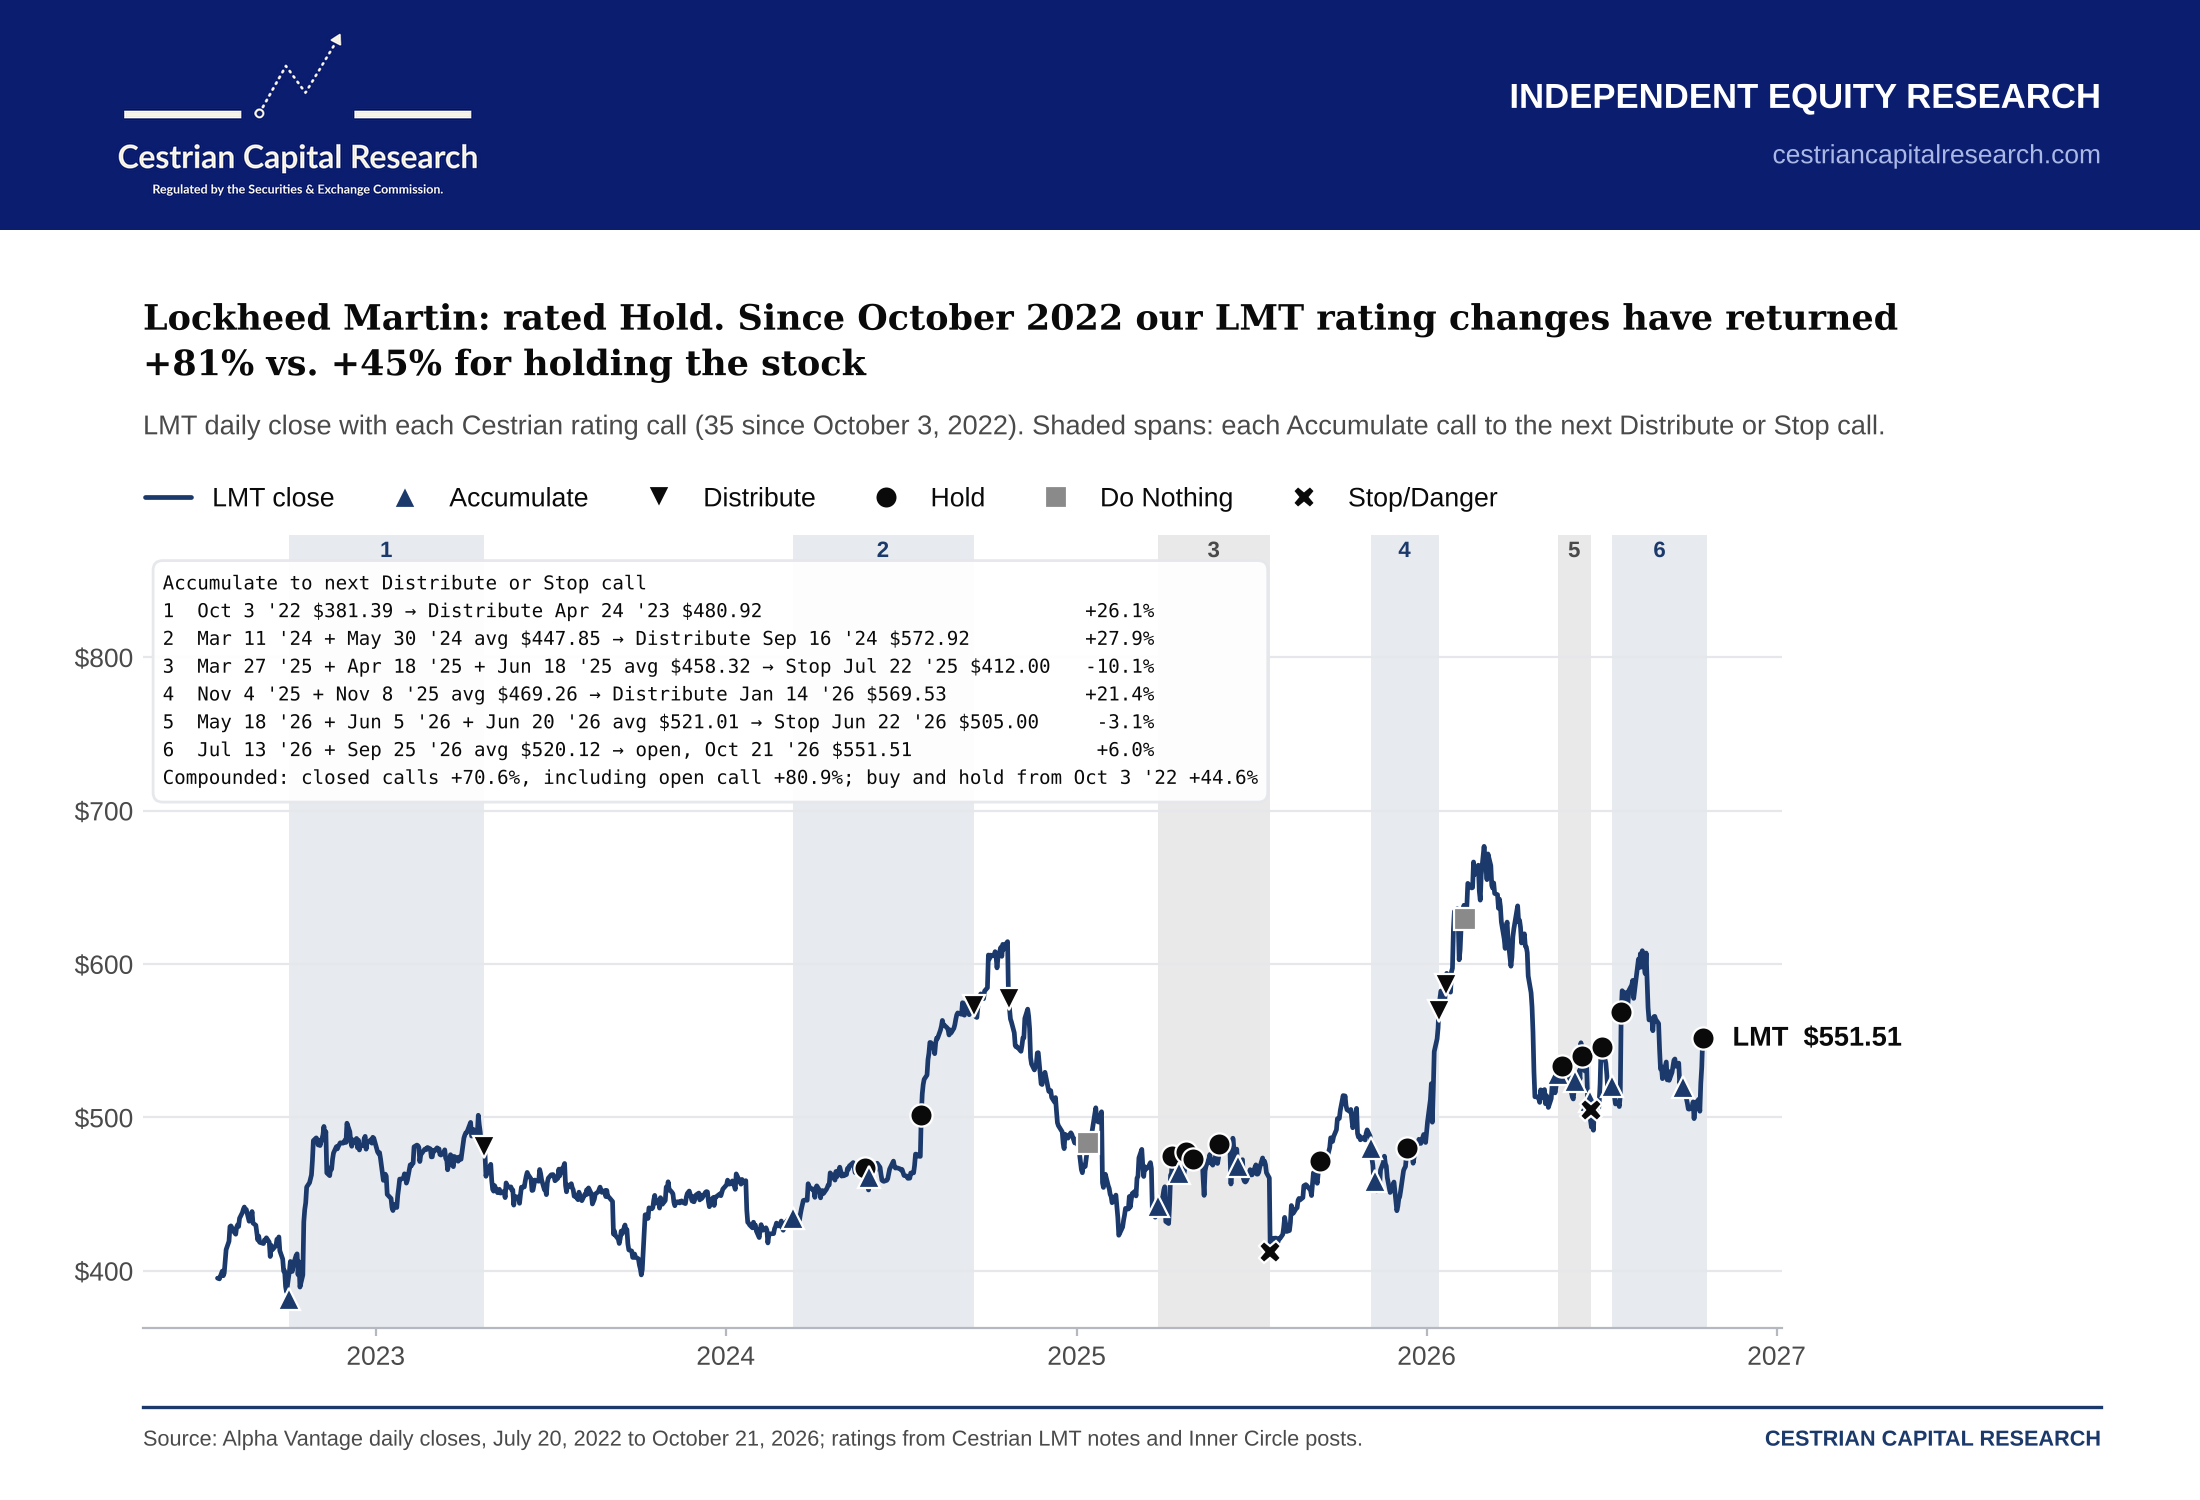
Lockheed Martin's Q3 missile sales rose 24% on PAC-3, THAAD, GMLRS and PrSM ramps, lifting Missiles and Fire Control backlog to $142.5…

Franco-Nevada, Wheaton and Texas Pacific Land built royalty and streaming businesses by buying fixed shares of mines and wells, tracing the…
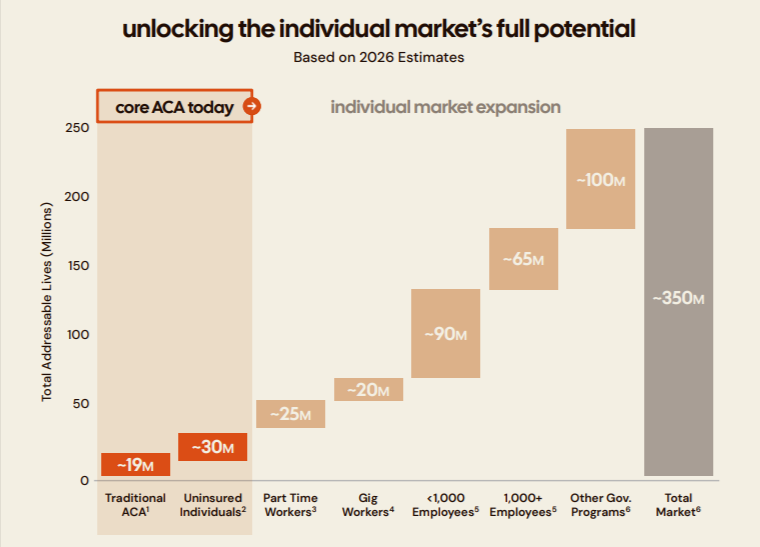
Oscar Health raised 2026 operating earnings guidance to $600 million-$800 million after ACA-marketplace expansion drove 60% membership and…
 CLF · long
Cleveland-Cliffs is pitched as a long on underappreciated earnings power, with more than 90% return potential over six to nine months.

Western Digital and Bloom Energy fell after strong quarterly results, extending the selloff in AI-linked stocks.
Credo’s microVCSEL pivot targets 10–20m data-center links where copper falls short, while microLEDs compete nearer compute on integration,…

Lam Research reported $8.22 billion in Q1 FY6/27 revenue, with systems up 62% and operating margin reaching a record 40% as memory spending…

HFI Portfolio bought 94,214 shares of Transocean, RIG, for $570,000 at $6.05 per share.

CoreWeave targets 8 GW of active power by 2030, expands into India and builds its AI cloud ecosystem through Google Cloud and partner…
 Jack Elias 6 clicks
MYR Group’s Q3 2026 preview cites data-center and power transmission demand, with long-term service agreements supporting margin growth and…
Mosaic’s potash business generated $930 million after capital spending and closure cash in 2025, while phosphate operations consumed $207…

Mosaic’s history traces the 2004 Cargill-IMC merger and the phosphate and potash mines that shaped NYSE: MOS.
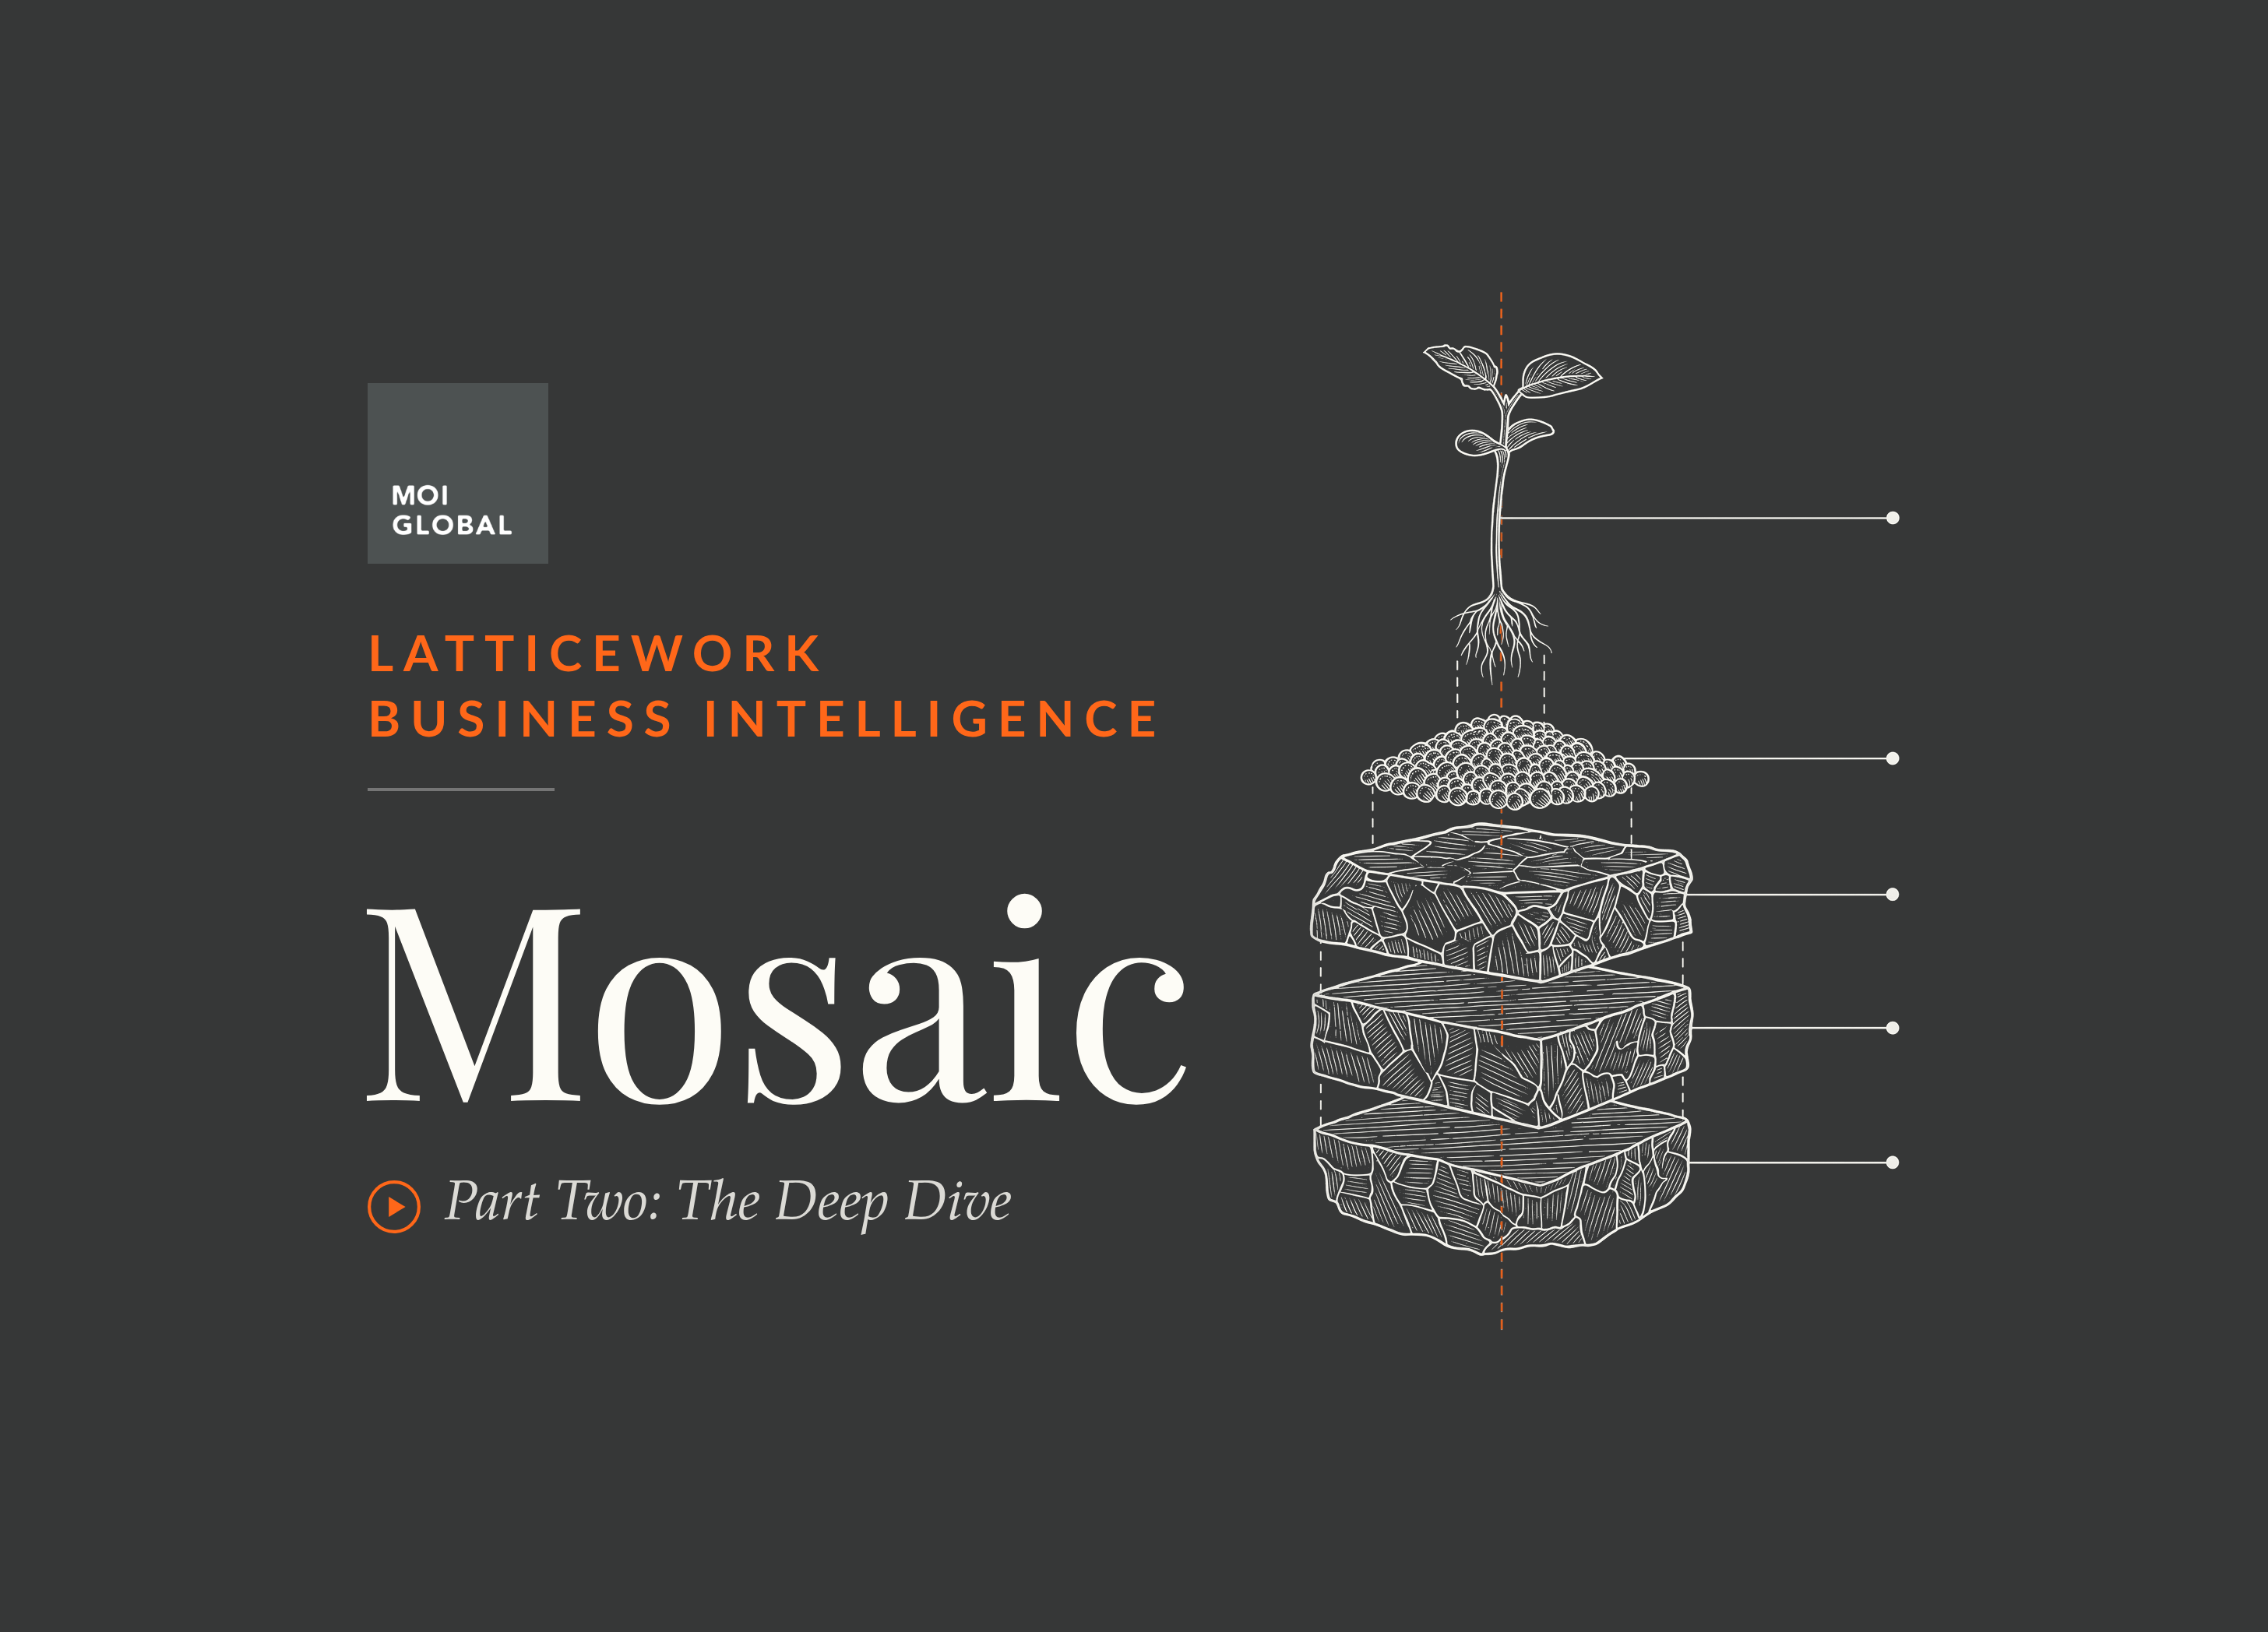
Mosaic, NYSE: MOS, is the subject of a second audio program for professional investors analyzing fertilizer producers.
Every publication on this site, hand-picked.
 Albert Anthony
 Andres Veurink
 Bay Area Ideas
 Blake Winiecki
 Capital Connoisseur
 David Zanoni
 Deep Value Investing
 Dhierin Bechai
 Dilantha De Silva
 Dustin Quasney
 Elliott Gue
 Equity Eagle
 Eudaemon Research
 Fernanda Galvez Jalil
 Henrik Alex
 High Alpha Professor
 Investor Overview
 IWA Research
 Jaden Mealy
 Julia Ostian
 Khaveen Investments
 Kurt Christensen
 LL Insights
 Long Player
 Marc Gerstein
 Melissa Tucker
 Mike Zaccardi, CFA, CMT
 Miletus Research
 Myriam Alvarez
 Petri Dish Reports
 Philip Wang
 Prakhar Agarwal, CFA
 PropNotes
 PV Research
 Quantryon Capital
 Robert J. Lake
 Ron Ferrie
 Ryan Canady
 Sam Mancini
 Sharon McArd
 SiliconBytes Insights
 Simple Investment Ideas
 Sorrento Research
 Stephen Ayers
 Steven Fiorillo
 The Alpha Analyst
 The Asian Investor
 The Bullionaire
 The Curious Analyst
 The J Thesis
 The Supercycle Investor
 The Undercovered Dozen
 Tim Travis
 Value Capital Research
 Vishal Jadaun
Every account on this site, hand-picked.
 ⚽️📡
 💥PETITION💥
 A Capital
 absreturnchaser
 Adam D. Wyden
 Alpha Vulture
 AltayCap
 Asif Suria
 Bank Reg Blog
 Barbarian Capital
 BDC
 Bill Ackman
 Brian McGough
 Broken Moats
 BuccoCapital Bloke
 Calvin Blissett
 catechwilliams
 Charles Frischer
 Chris Camillo
 Clark Square Capital
 Cluseau Investments
 Colin King
 Connor Haley
 Conor Maguire | Value Situations
 Convequity
 Dalius - Special Sits
 David Orr
 Deep Sail Capital
 Derek Pilecki
 Devin LaSarre
 DOMO Capital Management, LLC
 Edwin Dorsey
 Evan Tindell
 Fajasy
 Farmer
 Fierce_beast
 Fred Liu
 Gavin Baker
 George Noble
 Hunterbrook
 Ian Bezek
 Idea Brunch
 JabroniCoin.USD
 John_Hempton
 junkbondinvestor
 kab60
 KEDM.com
 Kevin Mak
 Kuppy
 Laughing Water Capital
 Lee Roach
 Little Owl Research
 Maius
 Maj Soueidan
 marginofdanger
 mavix
 Mike
 Mikro Kap David
 Mr Neutral Man aka "Howard Marks of REITs”
 Multiples Capital
 Myles
 Nat Stewart
 Negligible Capital
 Odd Diligence
 Odd Lot Arbitrageur
 PAA Research
 Paradis
 Pernas Research
 Porter Collins
 Prepared Remarks
 Psyop Capital
 Raging Capital Ventures
 Red Dog Capital RiverRoadPartners
 Rusholme Capital
 Sahil Khetpal
 Serenity
 SG
 Sheel Mohnot
 SouthernValue
 Steve Eisman
 The Friendly Bear
 Tim Eriksen
 Timyan Bank Alert
 Todd Wenning
 ToffCap
 Trevor Scott
 Undiscovered Compounders
 Voss Capital
 Yaron Naymark
Ordered by how often our editor reaches for them.