
OCP 2026: MicroVCSELs are gaining attention, but microLEDs still have a case
Credo’s microVCSEL pivot targets 10–20m data-center links where copper falls short, while microLEDs compete nearer compute on integration, power and thermal performance.
Credo’s microVCSEL pivot targets 10–20m data-center links where copper falls short, while microLEDs compete nearer compute on integration, power and thermal performance.
Another consecutive solid double beat this morning for $ROP with acceleration across all their prop data verticals https://t.co/mdWiAnYwpo
$NTWO 👀 https://t.co/UaSxfUJ3sF
I do deep value and small companies, however value can be anywhere. I did enjoy reading this though and it is compelling. $ORCL https://t.co/Ix1PyWwNIF

HFI Portfolio bought 94,214 shares of Transocean, RIG, for $570,000 at $6.05 per share.
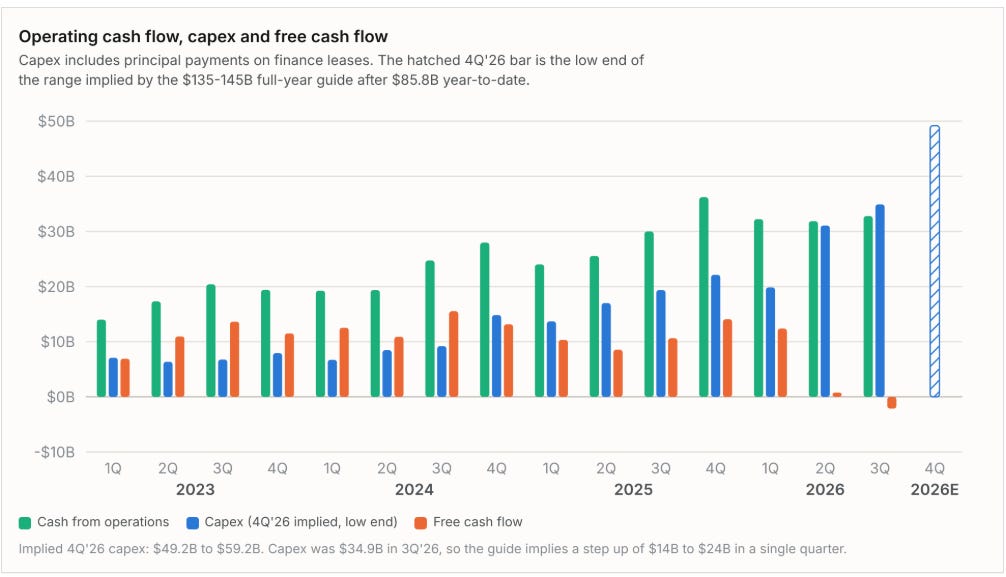
Meta’s ad revenue grew 26% to $63.1 billion, but negative free cash flow and $135-145 billion of capex raise concerns over AI funding and a…
CoreWeave targets 8 GW of active power by 2030, expands into India and builds its AI cloud ecosystem through Google Cloud and partner…
 Jack Elias 5 clicks
MYR Group’s Q3 2026 preview cites data-center and power transmission demand, with long-term service agreements supporting margin growth and…
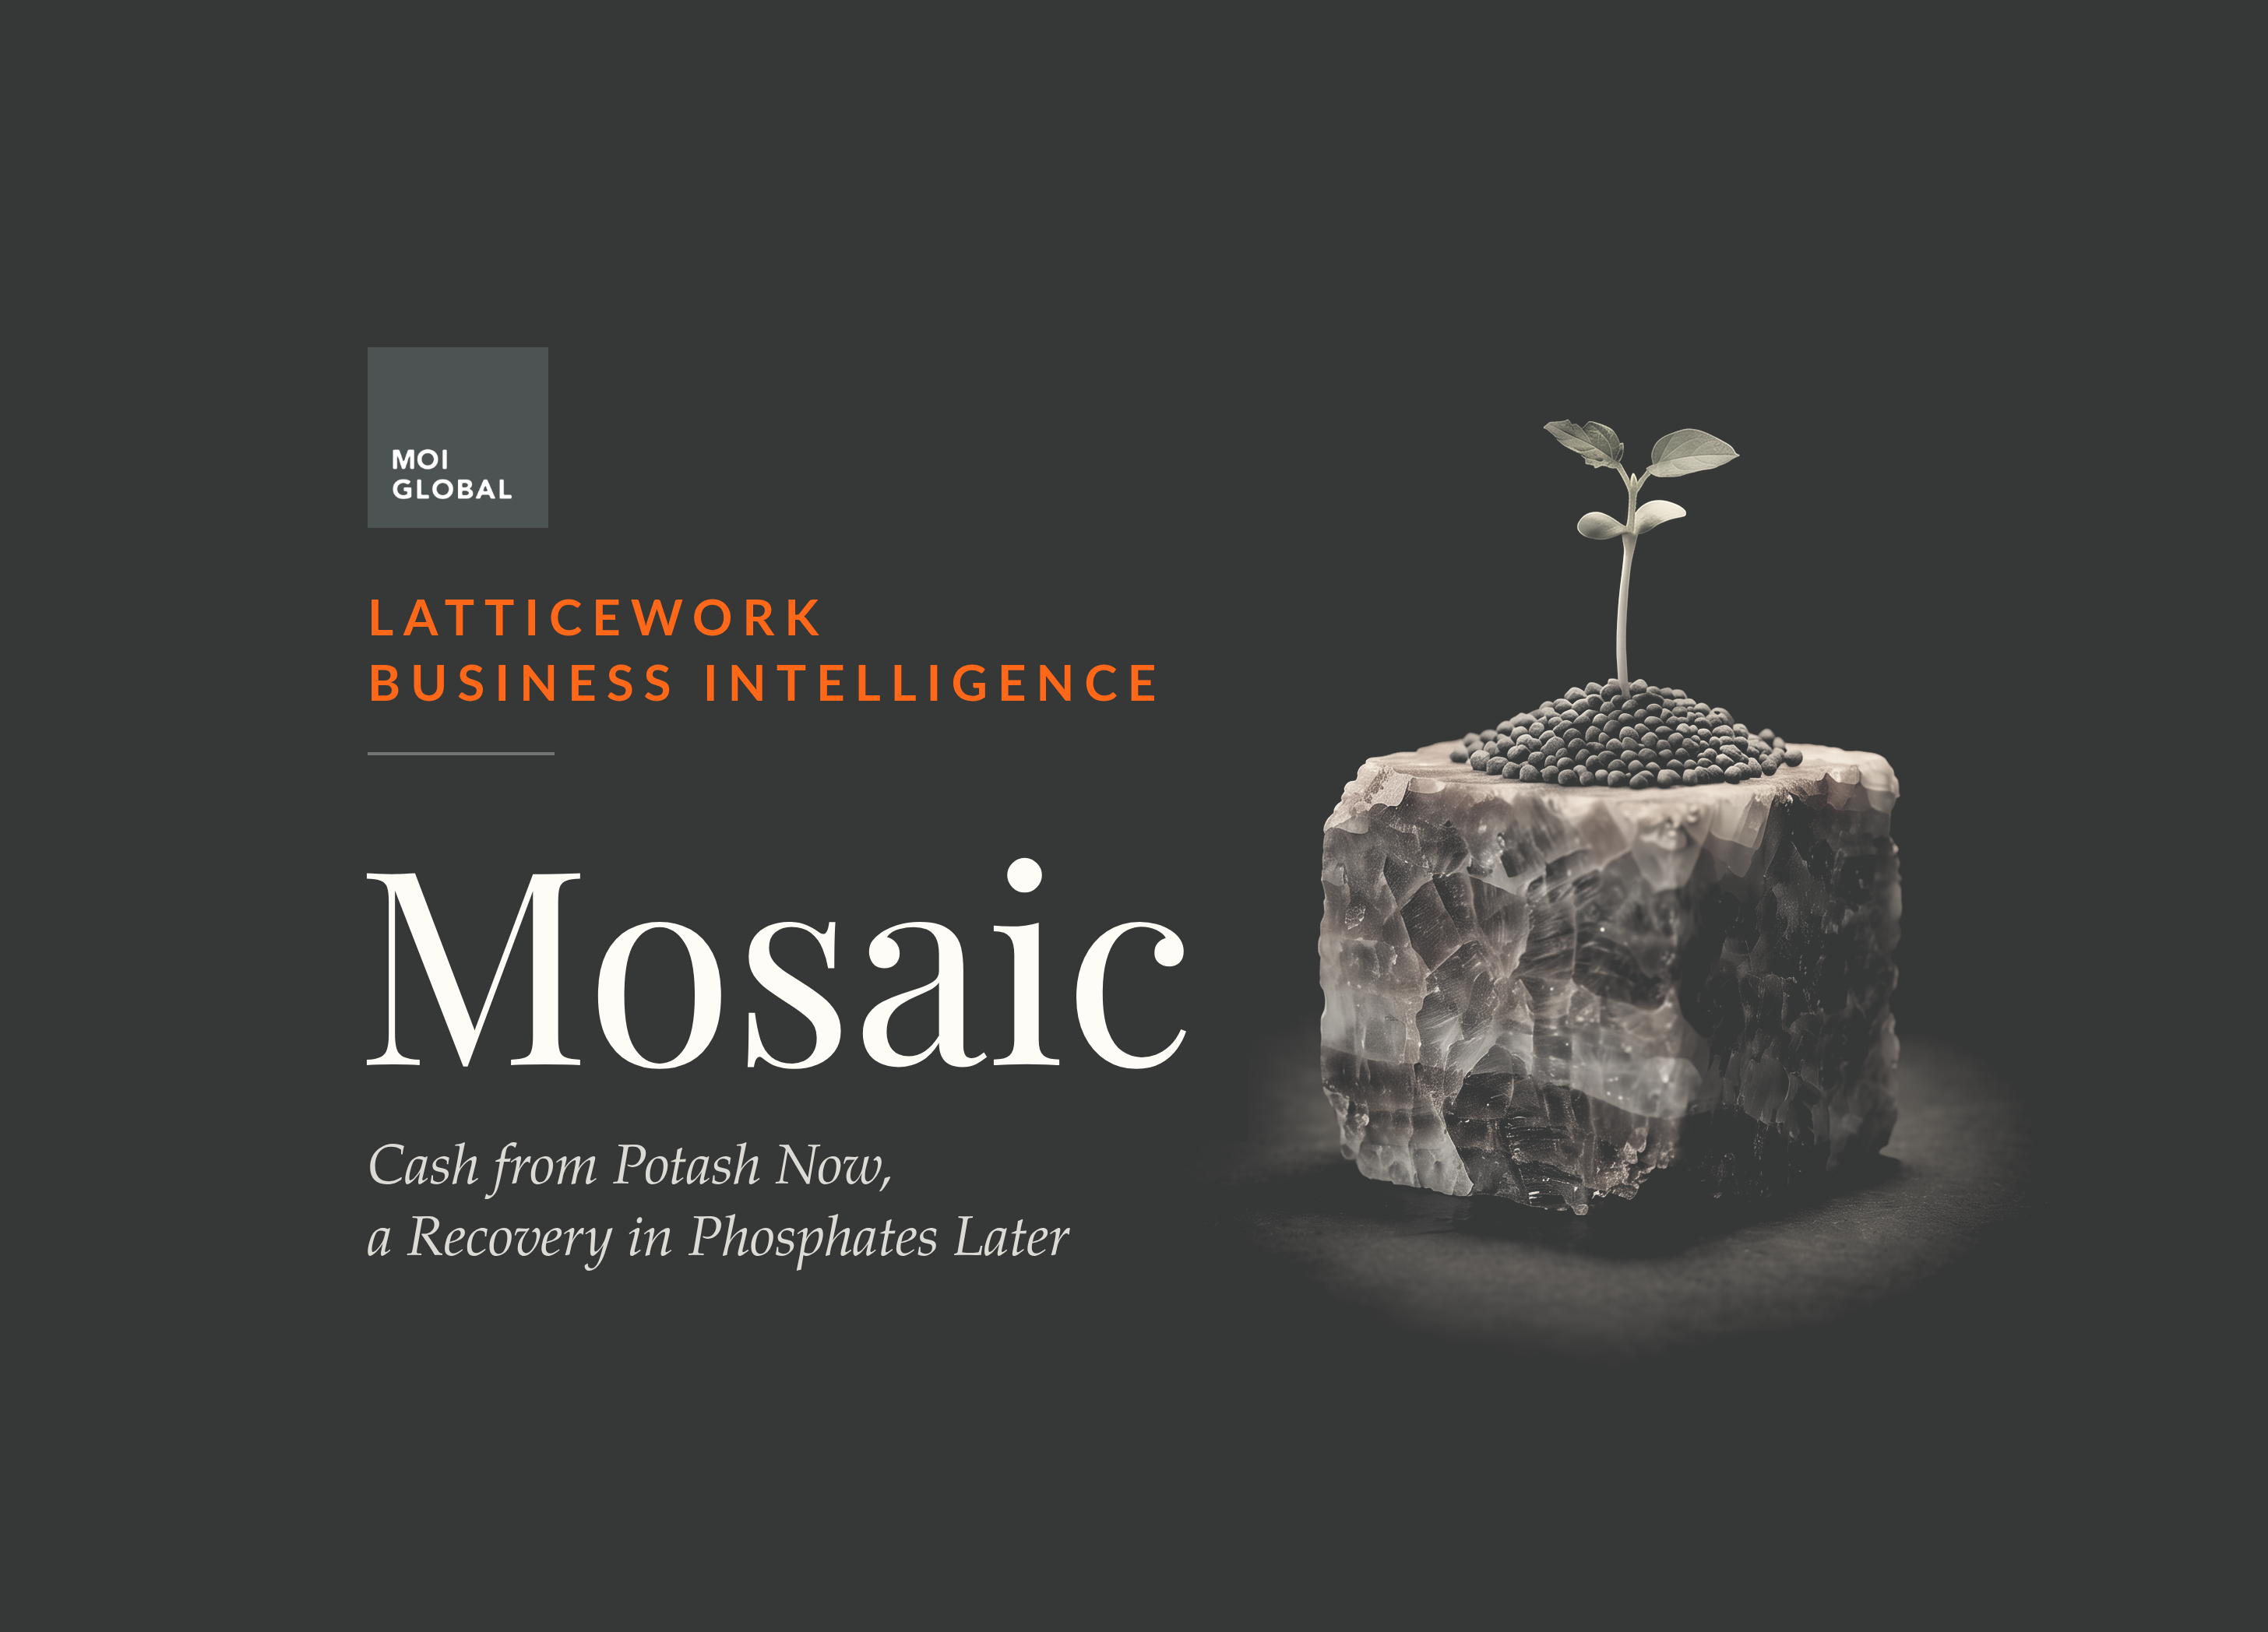
Mosaic’s potash business generated $930 million after capital spending and closure cash in 2025, while phosphate operations consumed $207…

Mosaic’s history traces the 2004 Cargill-IMC merger and the phosphate and potash mines that shaped NYSE: MOS.
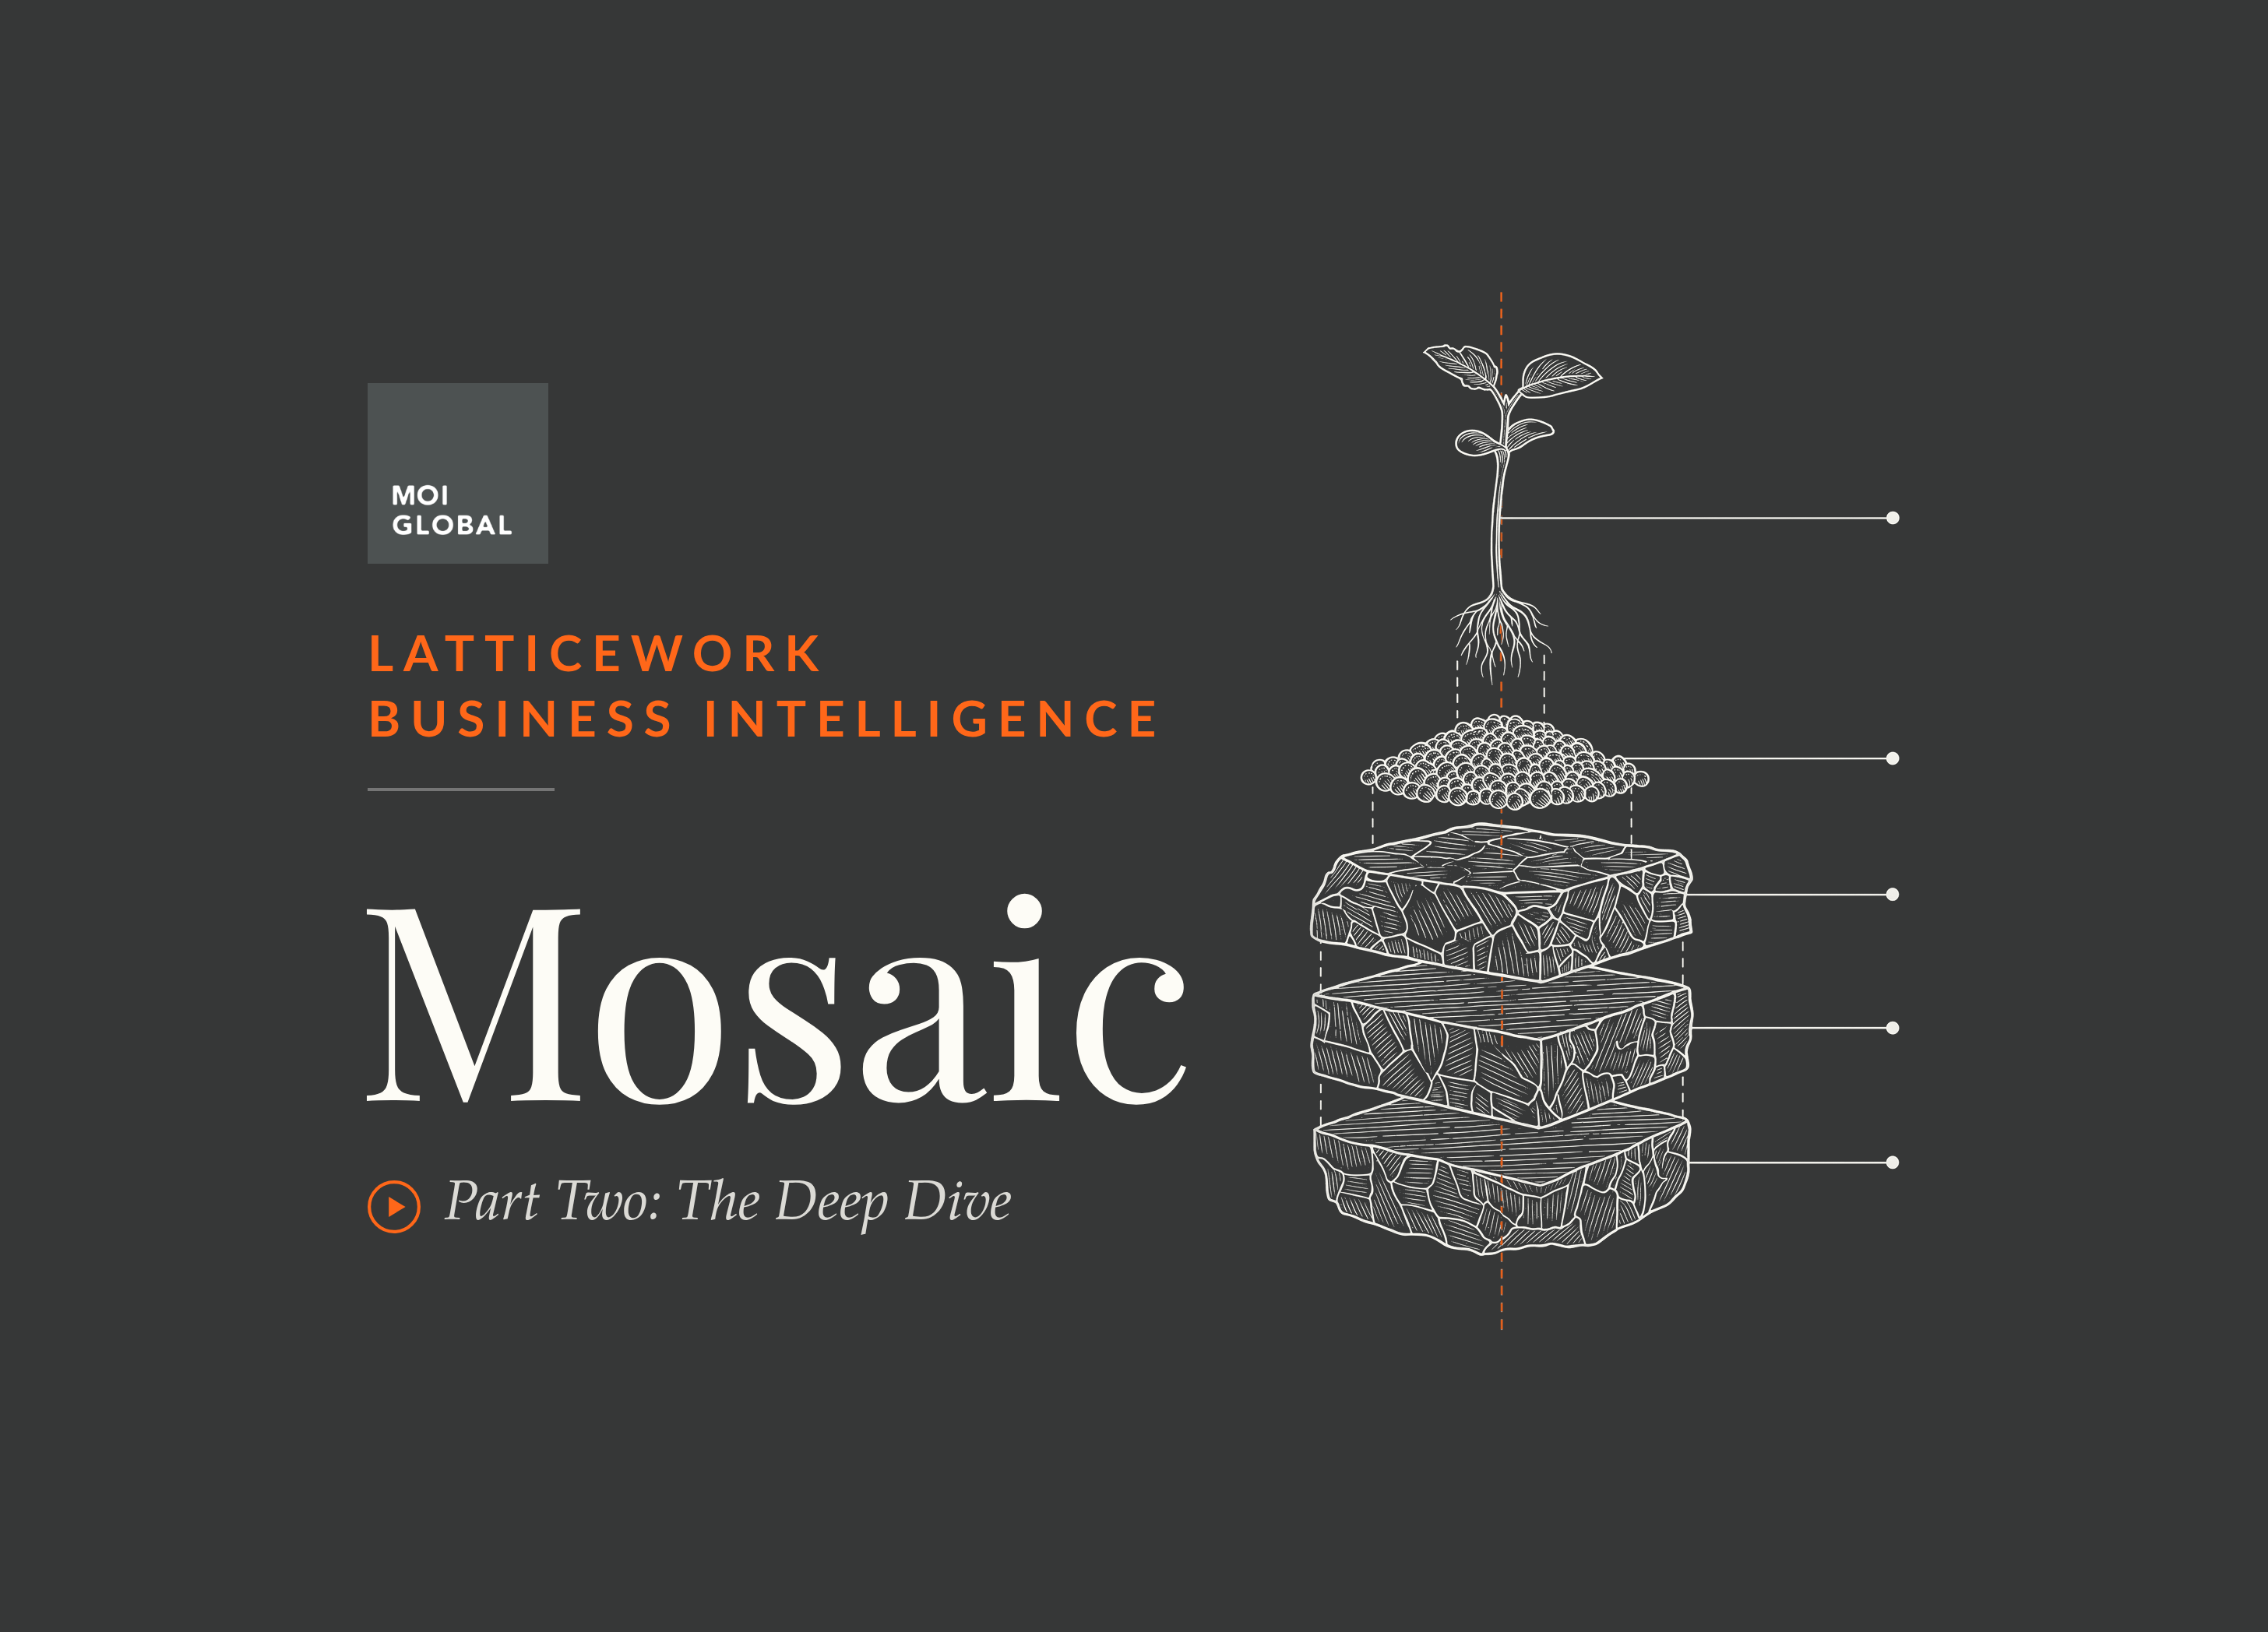
Mosaic, NYSE: MOS, is the subject of a second audio program for professional investors analyzing fertilizer producers.


Unicycive’s oxylanthanum carbonate NDA earned a March 25, 2027 PDUFA date after two manufacturing-related rejections, with no FDA clinical…
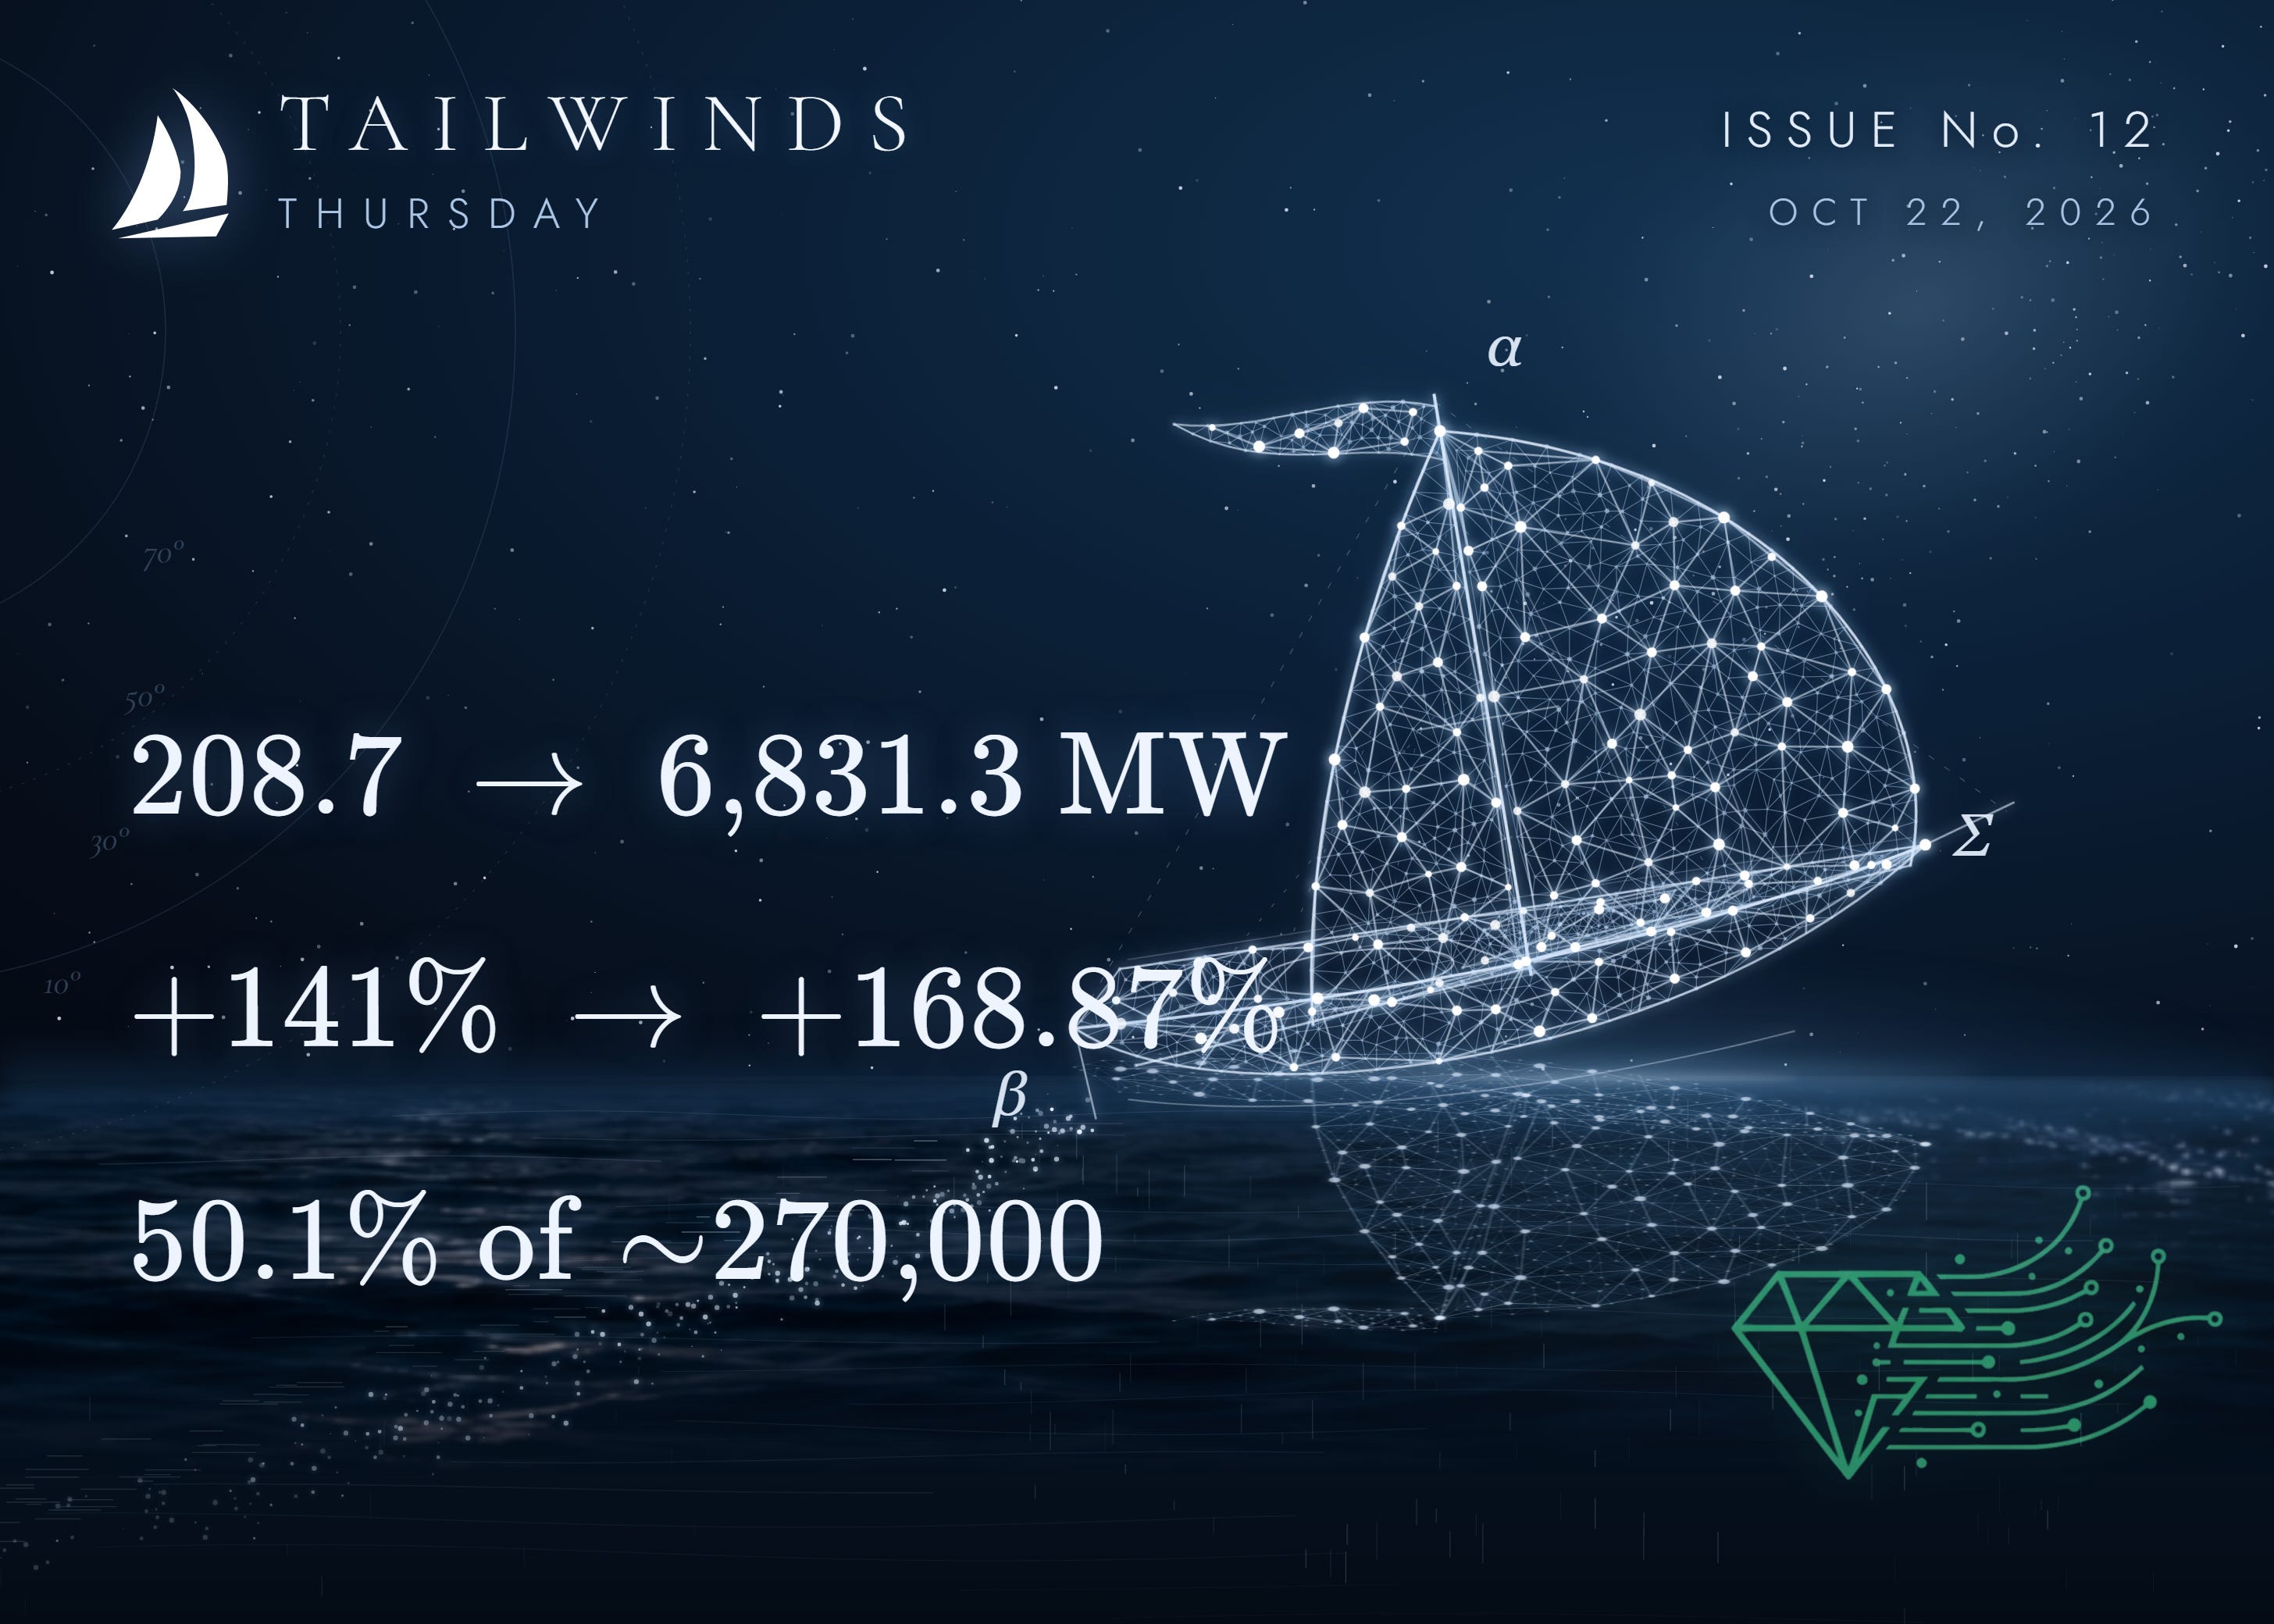
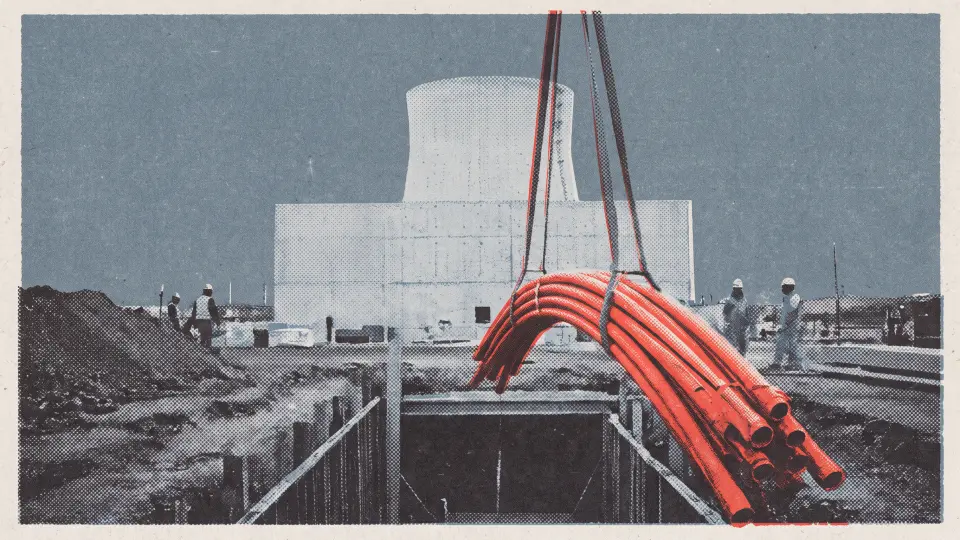
PJM's 6,831 MW capacity shortfall is driving nuclear uprates, with Google contracting 890 MW from 11 operating reactors.
Tesla’s Q3 revenue was flat at $28.0 billion, while operating income fell 56% as R&D spending on AI rose 69%; SpaceX merger discussions are…
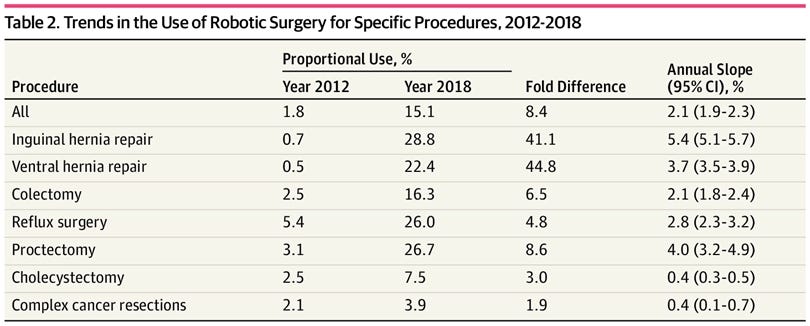
Intuitive Surgical built a razor-razorblade model around da Vinci robots, with procedure growth driving recurring instrument revenue and…

Meta’s Q3 revenue rose 26% to $64.6 billion, but $34.9 billion in AI infrastructure spending drove free cash flow negative as it created…

Meta’s Family of Apps revenue grew 26% as Muse reached 10 million users, testing AI-agent commerce while Amazon restricts access and…
Meta reported Q3 revenue of $64.6 billion, up 26%, while $34.9 billion of capex drove negative free cash flow and a $9.89 billion legal…
Solstice, Albertsons, Brockhaus and GM anchor a 34-case survey of activism, buybacks, M&A and strategic reviews, led by Starboard’s…
Rollins, North America’s largest pest-control provider, gets 75–80% of revenue from recurring contracts but has fallen about 45% year to…
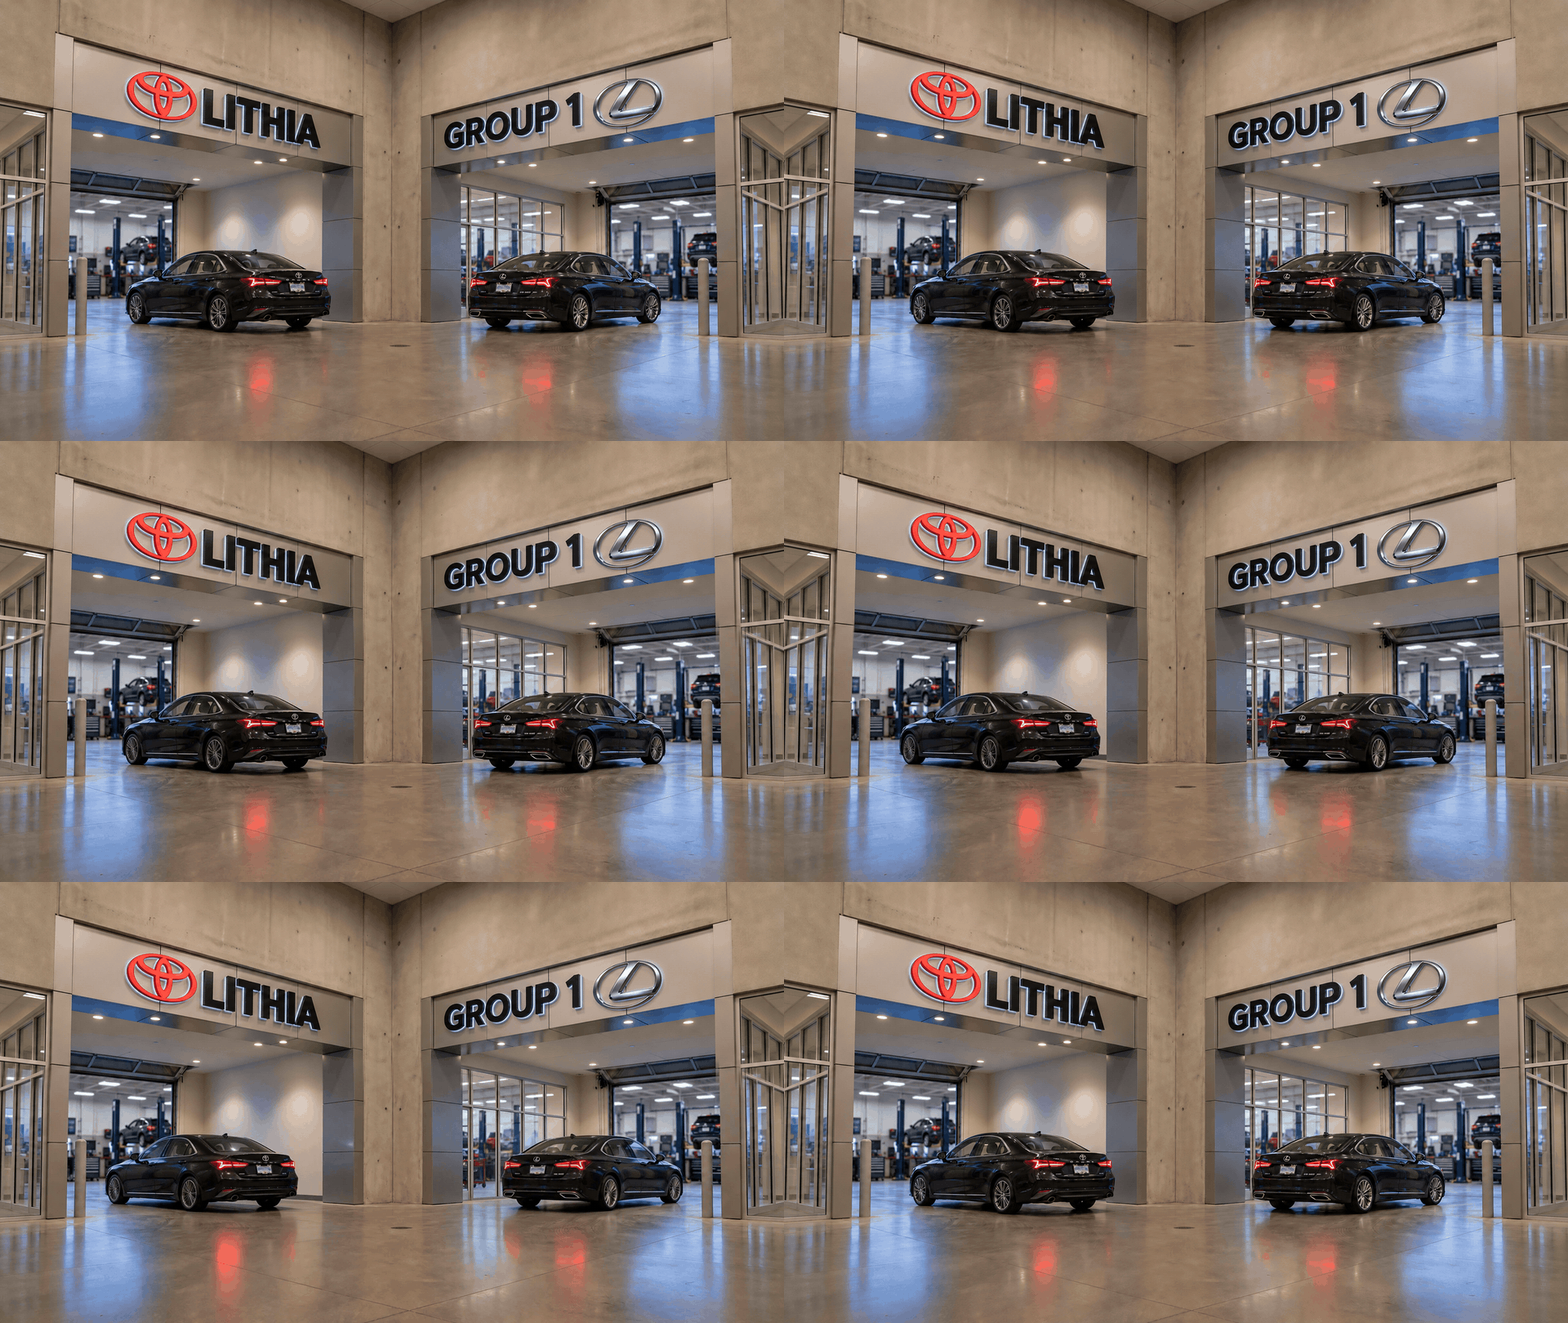
Group 1 Automotive and Lithia Motors divide two longtime value investors: David Abrams switched to Lithia in 2018, while Greg Alexander…

Atour Lifestyle combines an asset-light Chinese hotel franchise network with Atour Planet sleep-product sales, using guest rooms as product…
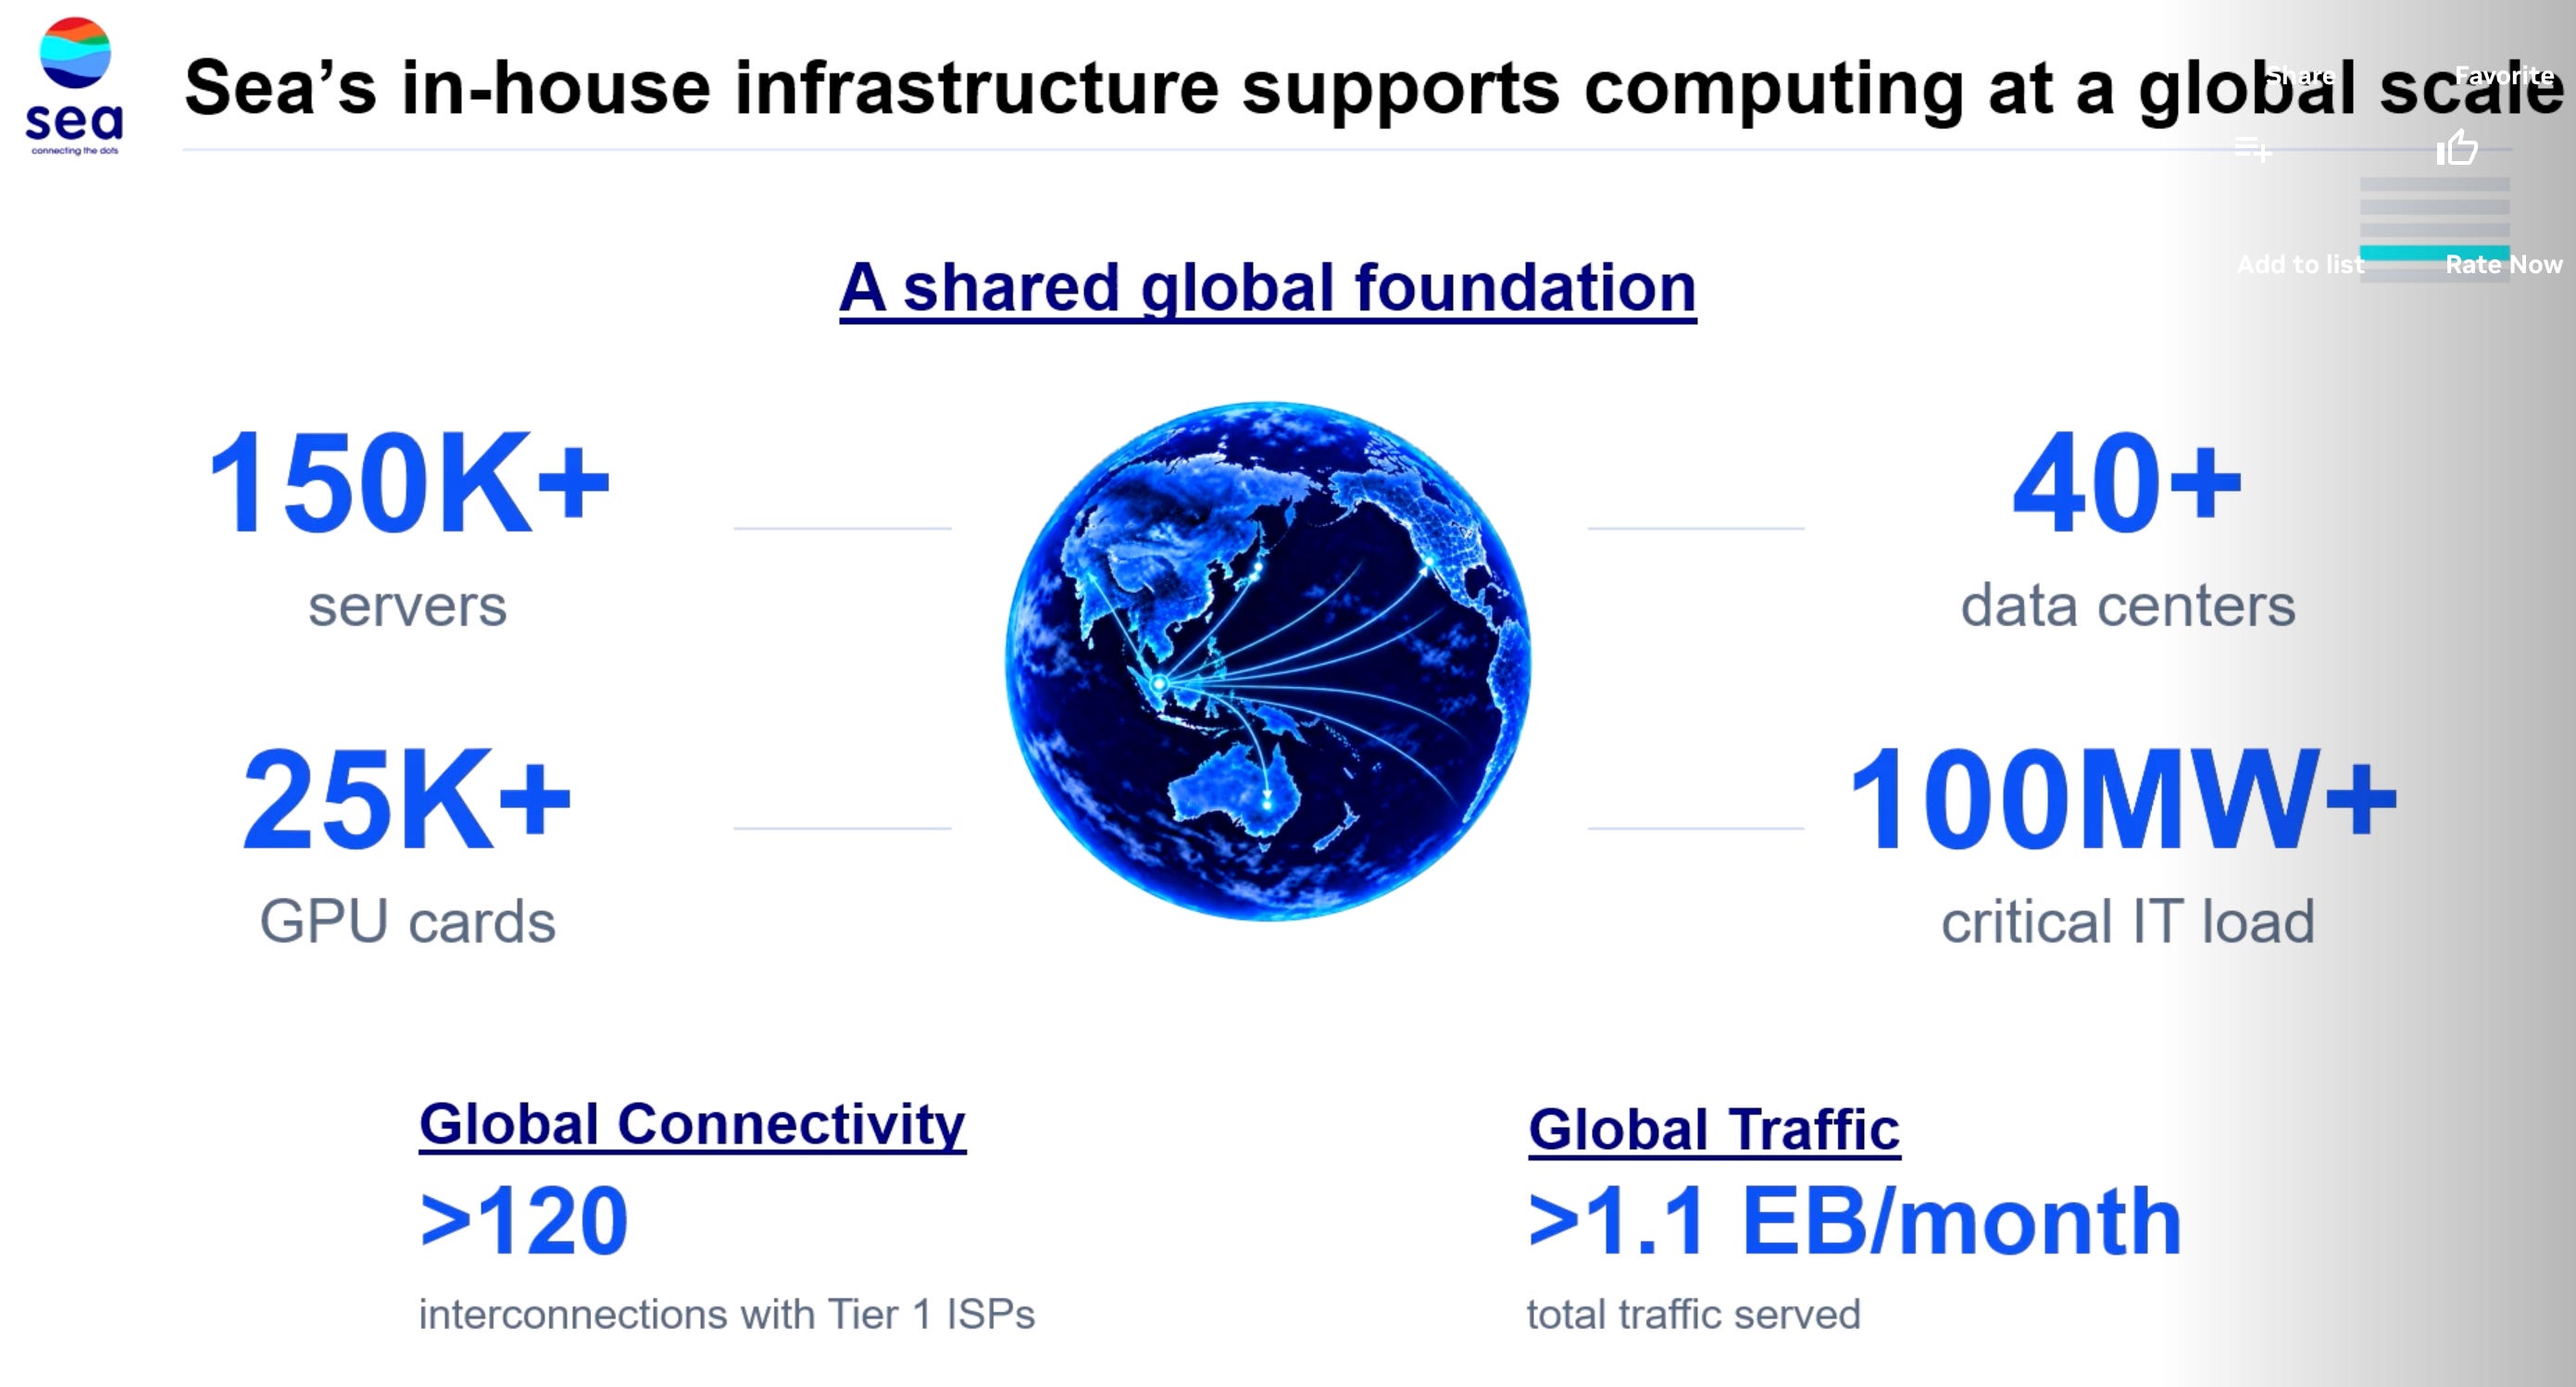
Sea Limited plans Sea Cloud and a Monee IPO, using 40-plus data centers and 25,000 GPUs while risking heavier capex and prolonged thin…
Every publication on this site, hand-picked.
 Albert Anthony
 Andres Veurink
 Bay Area Ideas
 Blake Winiecki
 Capital Connoisseur
 David Zanoni
 Deep Value Investing
 Dhierin Bechai
 Dilantha De Silva
 Elliott Gue
 Equity Eagle
 Eudaemon Research
 Fernanda Galvez Jalil
 Henrik Alex
 High Alpha Professor
 Investor Overview
 IWA Research
 Jaden Mealy
 Julia Ostian
 Khaveen Investments
 Kurt Christensen
 LL Insights
 Long Player
 Marc Gerstein
 Melissa Tucker
 Mike Zaccardi, CFA, CMT
 Miletus Research
 Myriam Alvarez
 Petri Dish Reports
 Philip Wang
 Prakhar Agarwal, CFA
 PropNotes
 PV Research
 Quantryon Capital
 Robert J. Lake
 Ron Ferrie
 Ryan Canady
 Sam Mancini
 Sharon McArd
 SiliconBytes Insights
 Simple Investment Ideas
 Sorrento Research
 Stephen Ayers
 Steven Fiorillo
 The Alpha Analyst
 The Asian Investor
 The Bullionaire
 The Curious Analyst
 The J Thesis
 The Supercycle Investor
 The Undercovered Dozen
 Tim Travis
 Value Capital Research
 Vishal Jadaun
Every account on this site, hand-picked.
 ⚽️📡
 💥PETITION💥
 A Capital
 absreturnchaser
 Adam D. Wyden
 Alpha Vulture
 AltayCap
 Asif Suria
 Bank Reg Blog
 Barbarian Capital
 BDC
 Bill Ackman
 Brian McGough
 Broken Moats
 BuccoCapital Bloke
 Calvin Blissett
 catechwilliams
 Charles Frischer
 Chris Camillo
 Clark Square Capital
 Cluseau Investments
 Colin King
 Connor Haley
 Conor Maguire | Value Situations
 Convequity
 Dalius - Special Sits
 David Orr
 Deep Sail Capital
 Derek Pilecki
 Devin LaSarre
 DOMO Capital Management, LLC
 Edwin Dorsey
 Evan Tindell
 Fajasy
 Farmer
 Fierce_beast
 Fred Liu
 Gavin Baker
 George Noble
 Hunterbrook
 Ian Bezek
 Idea Brunch
 JabroniCoin.USD
 John_Hempton
 junkbondinvestor
 kab60
 KEDM.com
 Kevin Mak
 Kuppy
 Laughing Water Capital
 Lee Roach
 Little Owl Research
 Maius
 Maj Soueidan
 marginofdanger
 mavix
 Mike
 Mikro Kap David
 Mr Neutral Man aka "Howard Marks of REITs”
 Multiples Capital
 Myles
 Nat Stewart
 Negligible Capital
 Odd Diligence
 Odd Lot Arbitrageur
 PAA Research
 Paradis
 Pernas Research
 Porter Collins
 Prepared Remarks
 Psyop Capital
 Raging Capital Ventures
 Red Dog Capital RiverRoadPartners
 Rusholme Capital
 Sahil Khetpal
 Serenity
 SG
 Sheel Mohnot
 SouthernValue
 Steve Eisman
 The Friendly Bear
 Tim Eriksen
 Timyan Bank Alert
 Todd Wenning
 ToffCap
 Trevor Scott
 Undiscovered Compounders
 Voss Capital
 Yaron Naymark
Ordered by how often our editor reaches for them.