
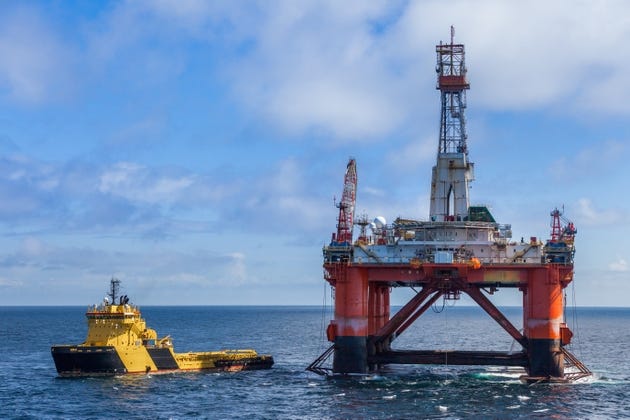
(Idea) Transocean - Near-Term Results Obscure A Brighter Future
Transocean’s 25.6% selloff reflects oil-market shorting and weak Q3 headlines, while debt reduction after the Valaris acquisition could reduce volatility and strengthen earnings.
Transocean’s 25.6% selloff reflects oil-market shorting and weak Q3 headlines, while debt reduction after the Valaris acquisition could reduce volatility and strengthen earnings.
Idea Brunch with Chris Colvin of @BreachInletCap Tickers discussed include $BKTI, $PRG, $BATRK, $LRN, and $HGV Enjoy! https://t.co/sY3RpWR3hz
@richtrades100 Yo $KYIV? https://t.co/KPar8yzxlq
M&A idea: $BCO closing on cash + stock acquisition of $NATL early 1Q27 Implied BCO market cap ~$5.5B post-close on $1B pro-forma FCF = 5.5x Leverage jumps to ~3.4x so they'll likely spend a few years balancing delevering No real arb situation, but worth watching...
$OC https://t.co/pA9b0mDR9D https://t.co/Mx02ZpE88d

Vicor earns a Strong Buy after record Q3 results and AI gains, while QXO falls to Hold over capital structure and execution risk.
 The Undercovered Dozen 1 click

TransMedics reported record Q3 2026 revenue exceeding $200 million, driven by its organ transplant technology business.

JFrog jumped 35% to $100.44 after another beat-and-raise quarter, joining the TL20 Special Situations group.

Twist Bioscience’s $200 rebound followed an Anthropic-linked short squeeze, yet its DNA and protein services face broad competition while…

Vishay reported record Q3 revenue of $979 million, up 24%, and guided Q4 to about $990 million as rising backlog and margins contrast with…
AutoNation, Lear, NexPoint, AudioCodes and Xponential Fitness lead a 52-situation screen spanning buybacks, insider purchases, M&A and…

 Rubicon Associates

Warrior Met Coal’s Blue Creek mine cut costs to about $93 a ton, offsetting a wider discount for High Vol A coking coal as US supply…

Aurelion Research increased healthcare exposure and sees opportunities in banking and defense, alongside research on Alcoa, Nike, ONON and…
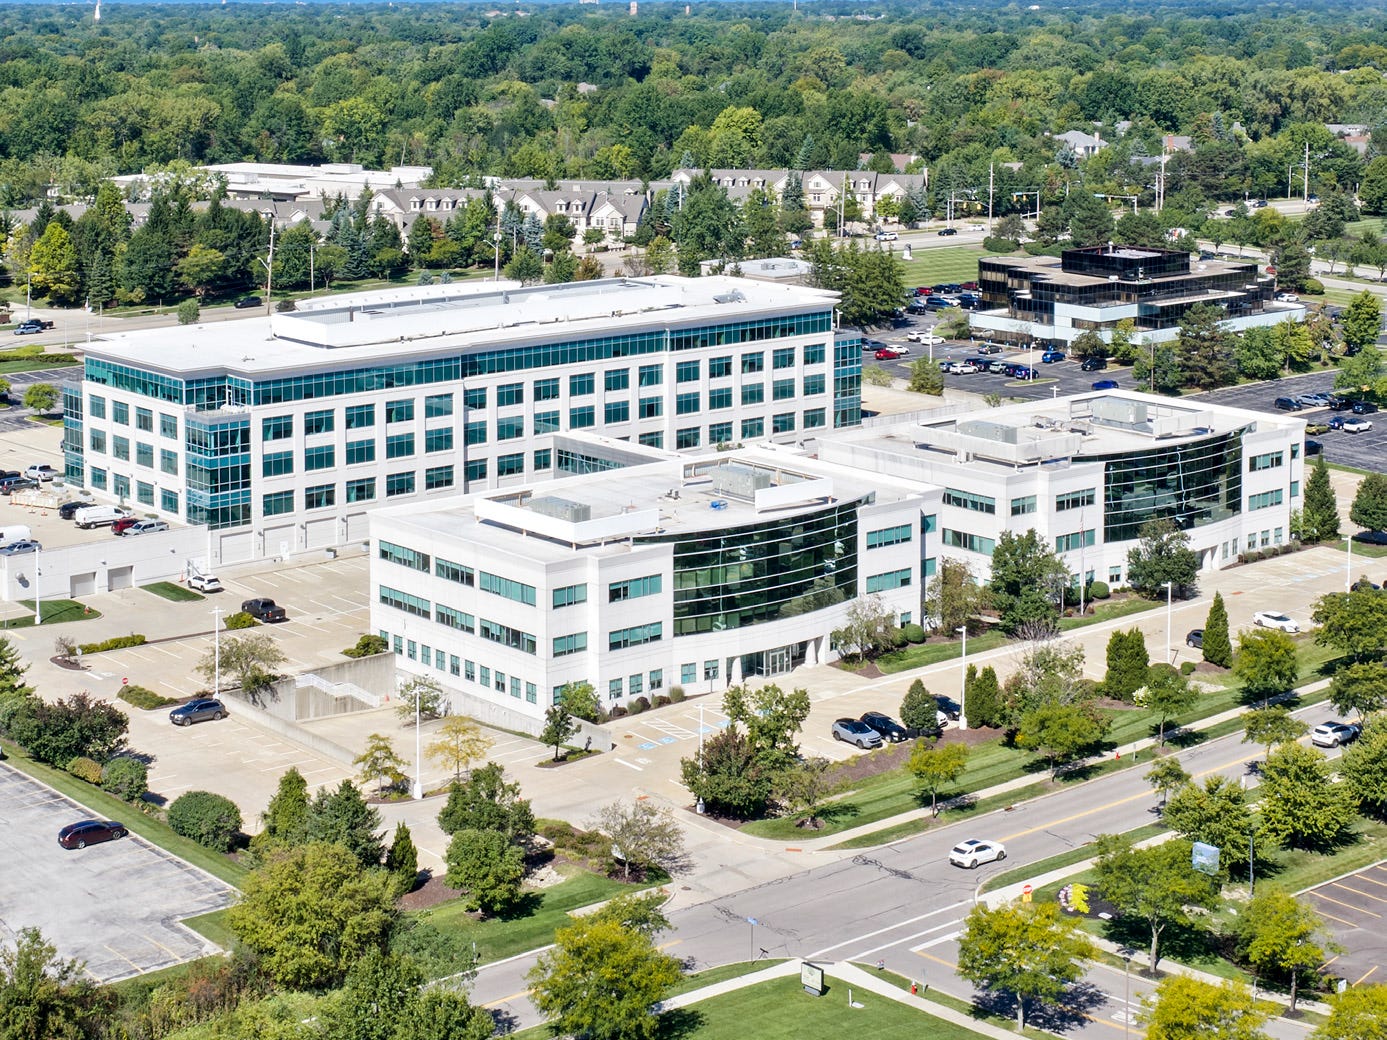
Site Centers' $3 per-share return-of-capital distribution and December delisting leave a discounted liquidation stub, with two properties…
 AAP · long
Advance Auto Parts, AAP, is presented as a long idea following prior write-ups at $48.81 per share in January 2025.

 Motti Sapir 2 clicks

David Orr describes running Militia Capital’s roughly 500-stock long-short portfolio, using expected value, correlation and factor…

AXT reported record Q3 revenue as AI data-center demand for indium phosphide drives supply agreements and capacity expansion.
 Alan Sumler 1 click
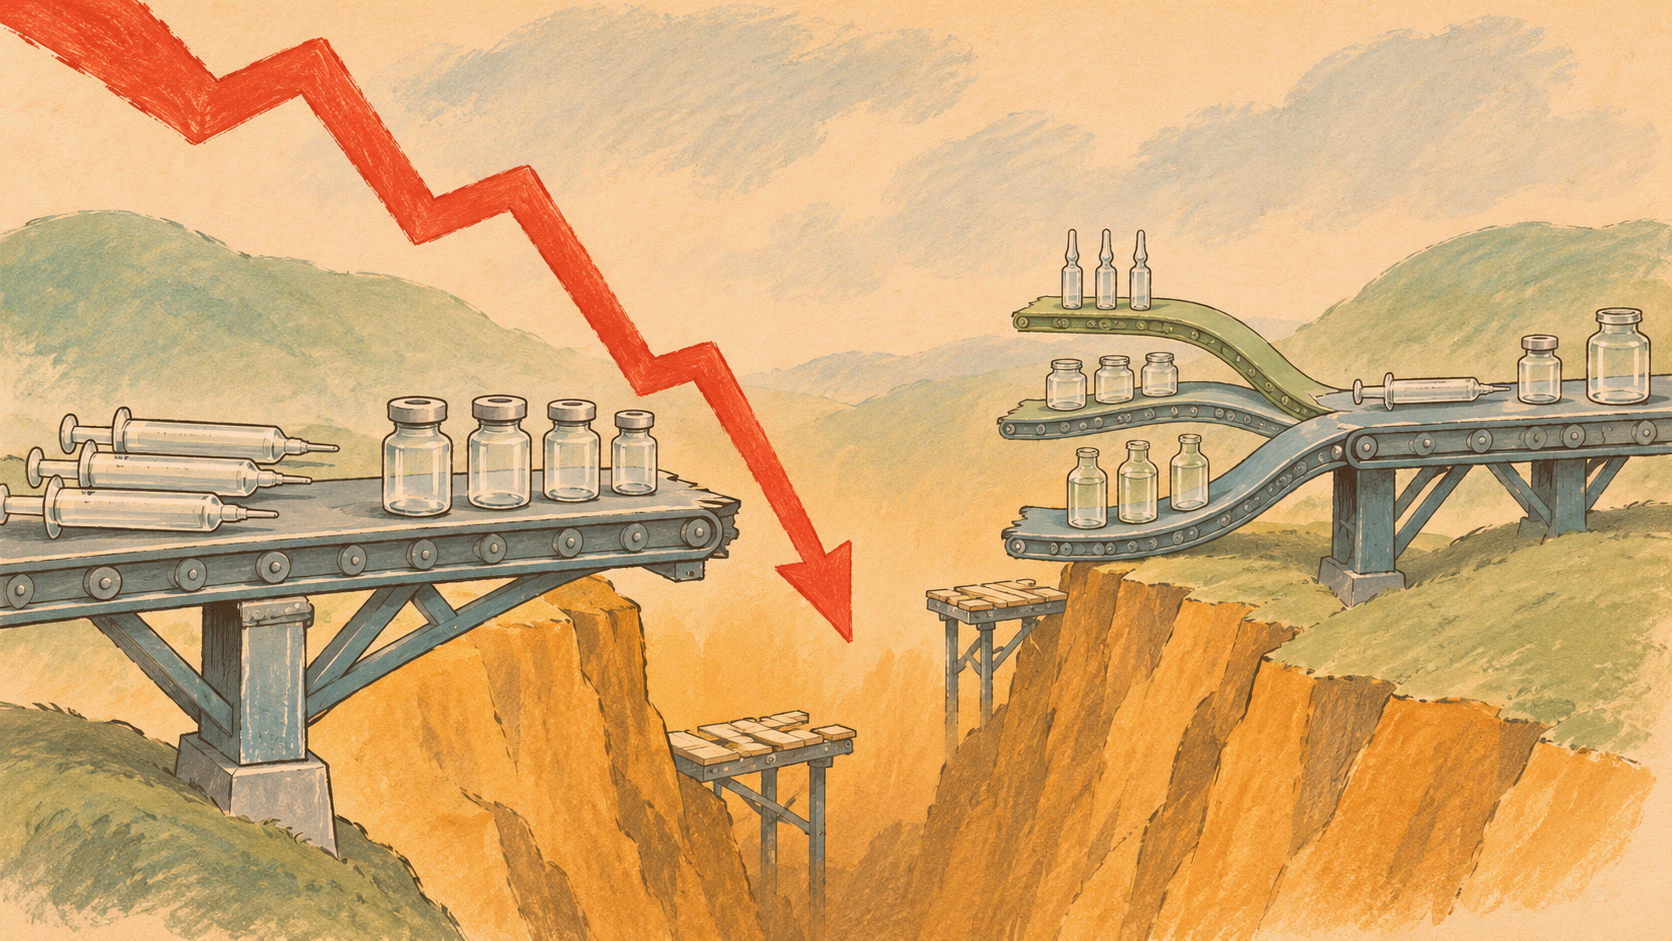
Stevanato fell 30% after forecasting low-single-digit 2027 growth as lower Nexa syringe volumes from a GLP-1 customer offset solid Q3…

Transocean enters its Valaris merger with 109 of 110 available deepwater rigs contracted and 313 million shares sold short, despite weaker…
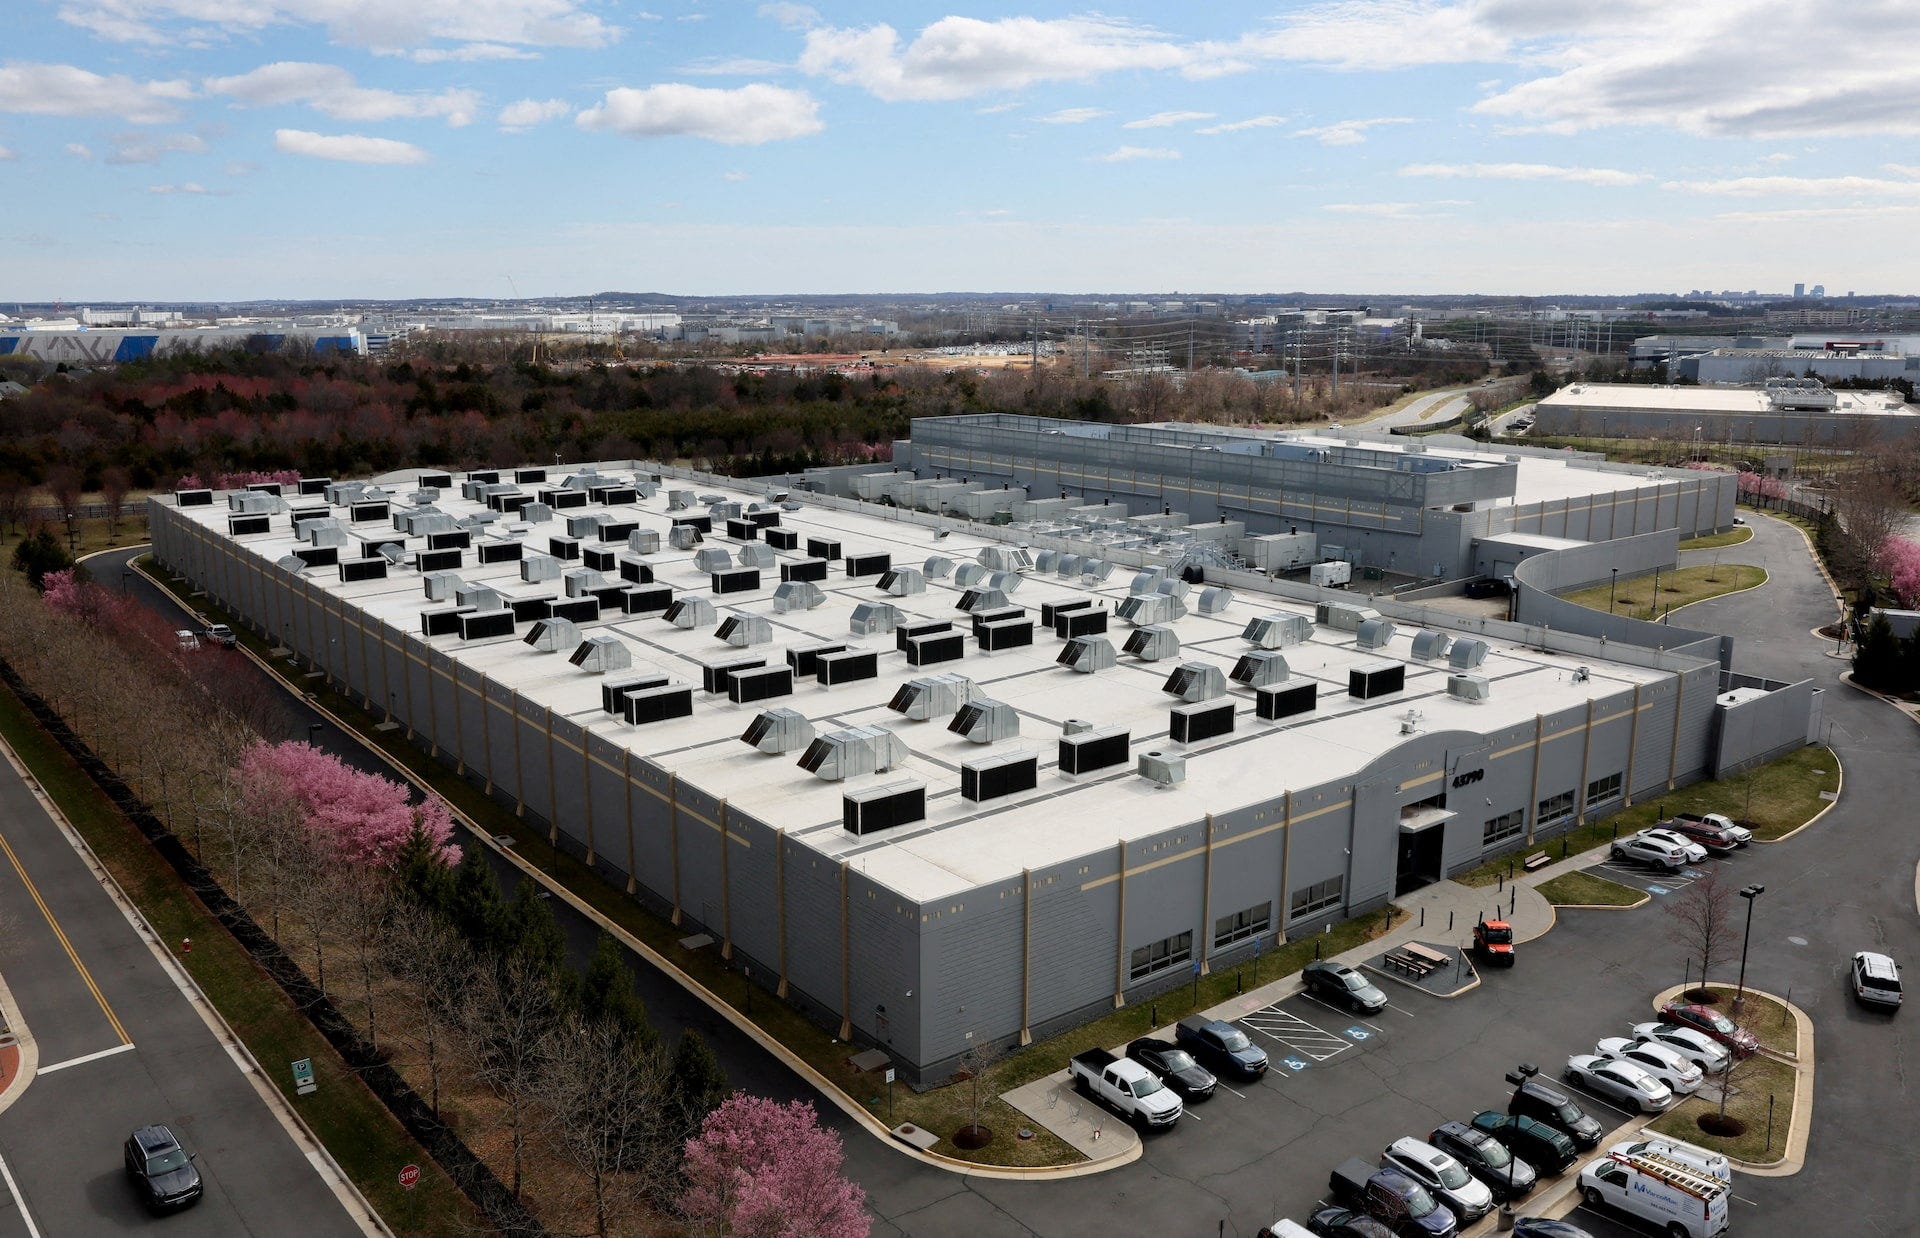
BXDC trades at a 14% discount to net liquidation value, with $1.9 billion of cash against a $1.6 billion market cap, ahead of data-center…

Essential Properties Realty Trust is growing faster than Realty Income through acquisition opportunities while trading at a cheaper…
 Jussi Askola, CFA
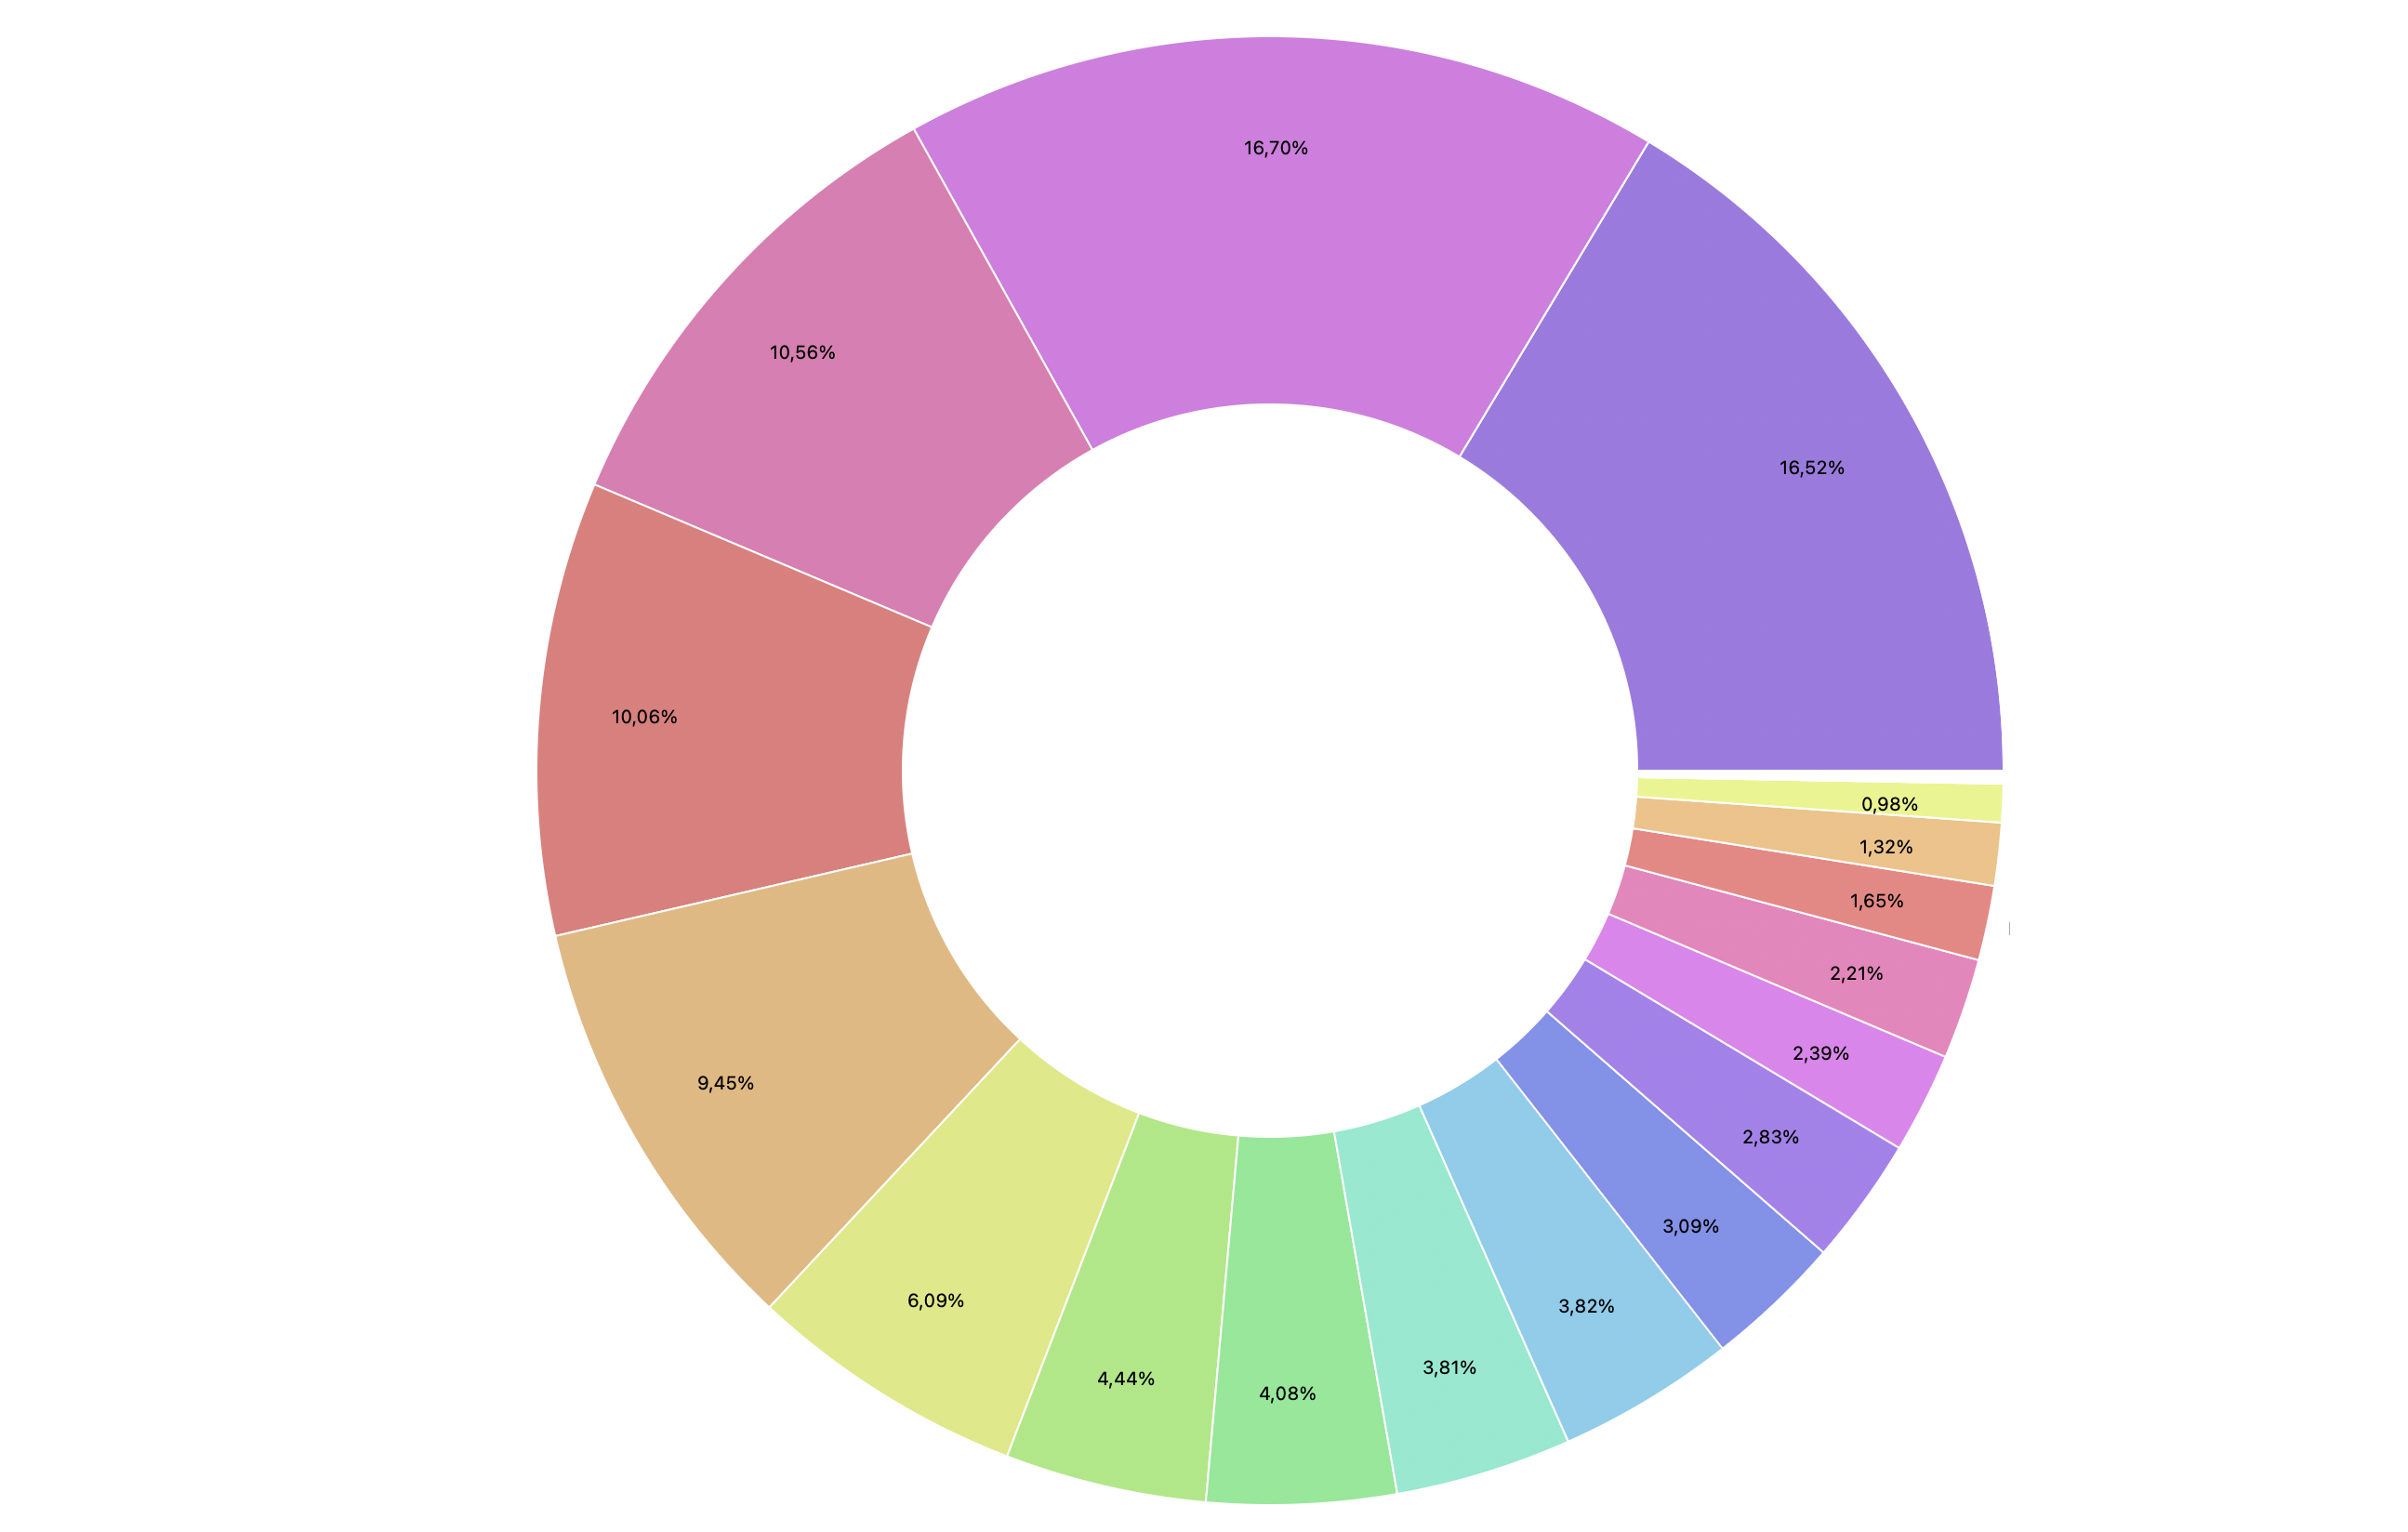
Calumet and other refiners sold off alongside AI names, but the RIN thesis for renewable fuel earnings remains unchanged ahead of Q3…
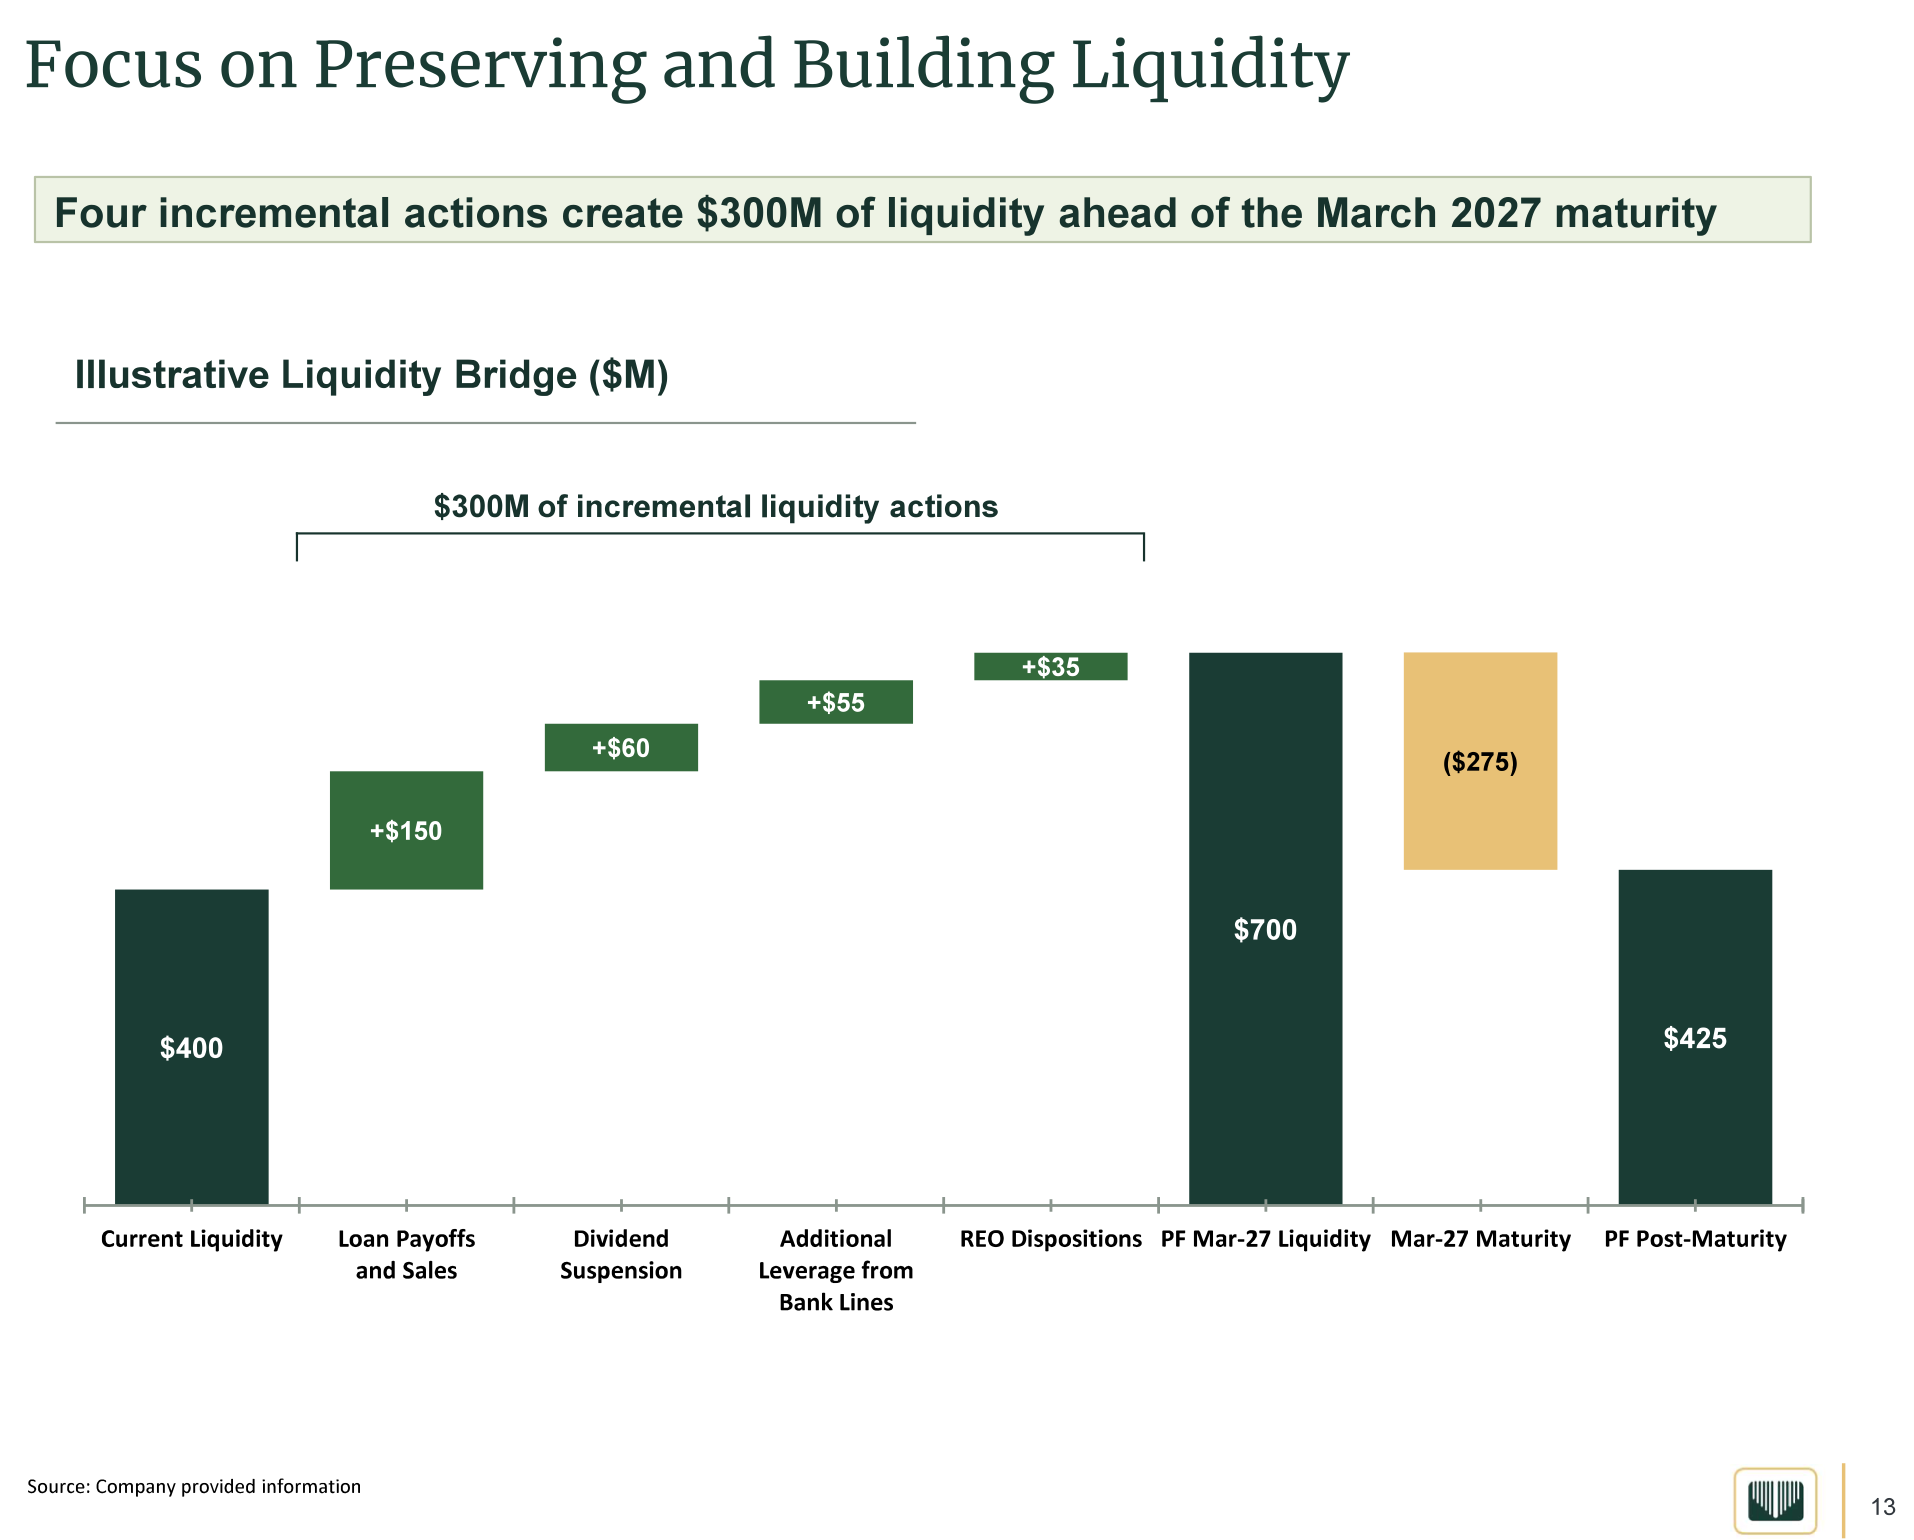
Arbor Realty Trust’s dividend suspension is presented as creating $60 million of liquidity, raising questions about its ability to meet…
Every publication on this site, hand-picked.
 Adam Schadt
 Albert Anthony
 Alexander Grover
 Andres Veurink
 Arizona Equity Research
 Bay Area Ideas
 Blake Winiecki
 Capital Connoisseur
 Cypriot Invests
 Dane Bowler
 David Zanoni
 Deep Value Investing
 Dhierin Bechai
 Dilantha De Silva
 Dustin Quasney
 Elliott Gue
 Equity Eagle
 Eudaemon Research
 Fernanda Galvez Jalil
 Fountainhead
 Geneva Investor
 Given Mahlangu
 Henrik Alex
 High Alpha Professor
 Ignacio Planas Gonzalez
 Infinity Curve
 Investor Overview
 IWA Research
 Jaden Mealy
 JR Research
 Julia Ostian
 Khaveen Investments
 Kurt Christensen
 Lee Bailey
 LL Insights
 Long Player
 Marc Gerstein
 Melissa Tucker
 Mike Arnold
 Mike Zaccardi, CFA, CMT
 Miletus Research Motti Sapir
 Myriam Alvarez
 Petri Dish Reports
 Philip Wang
 Prakhar Agarwal, CFA
 PropNotes
 PV Research
 Quantryon Capital
 Robert J. Lake
 Ron Ferrie Rubicon Associates
 Ryan Canady
 Sam Mancini
 Seeking Profits
 Sharon McArd
 SiliconBytes Insights
 Simple Investment Ideas
 Sorrento Research
 Stephen Ayers
 Steven Fiorillo
 The Alpha Analyst
 The Asian Investor
 The Bullionaire
 The Curious Analyst
 The J Thesis
 The Market Auditor
 The Supercycle Investor The Undercovered Dozen
 Tim Travis
 Uttam Dey
 Value Capital Research
 Vishal Jadaun
 Zoltan Ban
Every account on this site, hand-picked.
 ⚽️📡
 💥PETITION💥
 A Capital
 absreturnchaser
 Adam D. Wyden
 Alpha Vulture
 AltayCap
 Asif Suria
 Bank Reg Blog
 Barbarian Capital
 BDC
 Bill Ackman
 Brian McGough
 Broken Moats
 BuccoCapital Bloke
 Calvin Blissett
 catechwilliams
 Charles Frischer
 Chris Camillo
 Clark Square Capital
 Cluseau Investments
 Colin King
 Connor Haley
 Conor Maguire | Value Situations
 Convequity
 Dalius - Special Sits
 David Orr
 Deep Sail Capital
 Derek Pilecki
 Devin LaSarre
 DOMO Capital Management, LLC
 Edwin Dorsey
 Evan Tindell
 Fajasy
 Farmer
 Fierce_beast
 Fred Liu
 Gavin Baker
 George Noble
 Hunterbrook
 Ian Bezek
 Idea Brunch
 JabroniCoin.USD
 John_Hempton
 junkbondinvestor
 kab60
 KEDM.com
 Kevin Mak
 Kuppy
 Laughing Water Capital
 Lee Roach
 Little Owl Research
 Maius
 Maj Soueidan
 marginofdanger
 mavix
 Mike
 Mikro Kap David
 Mr Neutral Man aka "Howard Marks of REITs”
 Multiples Capital
 Myles
 Nat Stewart
 Negligible Capital
 Odd Diligence
 Odd Lot Arbitrageur
 PAA Research
 Paradis
 Pernas Research
 Porter Collins
 Prepared Remarks
 Psyop Capital
 Raging Capital Ventures
 Red Dog Capital RiverRoadPartners
 Rohan Pavuluri
 Rusholme Capital
 Sahil Khetpal
 Serenity
 SG
 Sheel Mohnot
 SouthernValue
 Steve Eisman
 The Friendly Bear
 Tim Eriksen
 Timyan Bank Alert
 Todd Wenning
 ToffCap
 Trevor Scott
 Undiscovered Compounders
 Voss Capital
 Yaron Naymark
Ordered by how often our editor reaches for them.