Microsoft: Cheap After A 27% Rally As The AI Bear Case Cracks
Microsoft’s Azure growth reached 43% as cloud and AI demand outpaced supply, while M365 Copilot’s seat-plus-consumption model supports…
 D.M. Martins Research
NASDAQ
MSFT
106 stories
$4T Market cap · 2026-11-05
Get MSFT news in Claude, ChatGPT or your own code. See plans
Microsoft’s Azure growth reached 43% as cloud and AI demand outpaced supply, while M365 Copilot’s seat-plus-consumption model supports…
D.M. Martins Research Convequity’s AI Bubble Barometer (ABBX) — Week 17 | 11 September 2026 Our weekly framework tracks valuations, returns, capex, financing risk and forward infrastructure economics across hyperscalers, neo-clouds and model labs. This week’s print is also an Oracle week. $ORCL reported FQ1 FY27 on 10 September: revenue and cloud growth accelerated, disclosed backlog (RPO) jumped to $664B, cash capex ran hot, FCF stayed negative but better than feared, and a $20B ATM equity sale was completed. Capacity delivery was the operational headline — 850 MW and >300k GPUs in the quarter. The ABBX read is below. As of 10 Sep session close (US ET), 13 selected companies (hyperscalers + neo-clouds): -EV / IC = 5.80x (↓ 0.06x from 5.86x on 4 Sep Friday close; ↓ 1.87x from 7.67x on 15 May series start) - All-in EV / IC (incl. private OpenAI & Anthropic) = 6.52x - ROIC / WACC = 3.07x in Q2'26 vs. 3.73x in Q1’26 - ROIC – WACC spread = +23.1% EV/IC tells you what the market is paying for every dollar of invested capital. ROIC/WACC tells you whether those dollars are still earning more than they cost. A classic bubble is when EV/IC keeps expanding while ROIC/WACC is rolling over. That is still not the setup. Returns remain more than 3× the cost of capital while EV/IC for the public builder set sits near 5.8x — well below the midsummer 7× prints and the 15 May series start. The multiple compression looks more financing-driven than fundamental: the return spread is still wide. Oracle is the live test of that financing channel — and on ABBX it sits halfway between the diversified hyperscalers and the neo-clouds. Start with backlog. ORCL’s $664B RPO is now in the same league as $MSFT (~$678B) and ahead of $GOOGL (~$520B) and $AMZN (~$496B). Neo-clouds are a different scale entirely: $CRWV ~$104B, $NBIS ~$40B, $IREN ~$17B. On disclosed backlog, Oracle is already peer to Microsoft — hyperscaler-scale contracted AI demand. The constraint is not finding counterparties; it is delivering power, GPUs and campuses against a backlog that already exceeds its AI enterprise value (EV/RPO ~0.7x on the company row). Valuation paints the halfway case. On Forward Valuation, Oracle’s AI EV is roughly mid-hundreds of billions against ~$163B/year of plan-implied revenue (~12.8 GW internal × ABBX blend (colo vs. GPU rental vs. mode/app derived revenue) — about 2.8x EV / plan-implied revenue and ~4.3x EV / implied gross profit. That sits well below Microsoft, Amazon and Google (roughly high-single-digit to low-double-digit EV/plan on the same framework) and Meta (~4.5x), but well above CoreWeave and IREN (sub-1x to low-1x on plan revenue). EV/IC tells a similar story: Oracle is cheaper than the big four diversified names and closer to the neo-cloud pack on capital multiples, while its backlog and quarterly capex now look hyperscaler-sized. The market is pricing Oracle more like a leveraged AI builder than like Azure/AWS/GCP — even though its contracted demand book looks like theirs. Capacity mix explains part of the gap. In AI Infrastructure Capacity Plans, Microsoft, Amazon, Meta and Google all show some external planned GW — capacity rented from specialists such as CoreWeave, Nebius and IREN. Oracle shows none. Its disclosed plan is treated as internal OCI build. Oracle is the landlord in this graph, not a tenant: it sells AI cloud to frontier labs and enterprises, and does not need a large rented-GPU line to hit the plan. That is control and a cleaner path to own-stack margin. It is also concentration. Build cost, leases and delivery sit on Oracle, not on a diversified supplier set. The Implied Revenue & Valuation Multiples table shows the same shape in the numbers. Oracle’s implied ABBX USD per planned GW is about USD 13 billion, below Microsoft at about USD 17 billion and well below Meta and Google in the mid-20s. That is not a claim that OCI is worse infrastructure. It is a revenue-density assumption. Oracle’s plan is weighted to large-contract AI infrastructure sold to hyperscale counterparties, closer to wholesale cloud economics. Meta and Google’s higher implied USD per GW embeds denser take on their own AI and platform stacks. CoreWeave can look high on a thin equity base. Oracle is the opposite: a huge RPO and more conservative revenue per gigawatt of disclosed plan. Financing is where Oracle looks more neo-cloud than Microsoft. Our Expanded Debt & Capex, split by disclosure vintage: From FQ1 FY27 (31 Aug, condensed balance sheet in the earnings release): borrowings $125.3B, cash $36.4B, IC $156.2B, plus operating-lease ROU/liability lines on the face of the BS. Still on the May / Q4 FY2026 full note lock (not in the FQ1 PR): on-books stack ~$167B (~1.3× borrowings), uncommenced DC leases ~$260B, purchase obligations ~$13B, all-in burden ~$441B (~3.4× borrowings). That roughly 3.4× all-in multiple sits near Amazon (about 4×) and above CoreWeave (about 2.5×) and IREN (about 2.9×), but far below Microsoft (about 17×), Google (about 10×) and Meta (about 9×). Those names carry large off-balance-sheet lease books relative to thinner headline debt. Oracle’s uncommenced lease line is still huge; the multiple looks moderate only because borrowings themselves are already large. The setup is notes debt, a completed ATM equity raise, heavy cash capex, negative FCF, and a large May commitment book that the next 10-Q still needs to update. Management says new contracts need no further equity raise. ABBX treats that as a claim to monitor, not a free pass. Oracle’s Q1'27 cash capex was about USD 28.5 billion — in the same league as Meta, below Microsoft, still below Amazon and Google. Against that sits about USD 664 billion of contracted future work, more than twenty times one quarter’s build spend, with management guiding that roughly half should become revenue inside three years. That is the highest backlog-to-build ratio in the group, and it is why demand on paper looks full. It does not mean this year’s cash bill is already paid. RPO is multi-year revenue, not cash this quarter. Capex is a repeating outflow — FY27 guidance is about USD 90–95 billion, or about USD 70 billion net after customer prepays — and Oracle has also signed about USD 260 billion of data-center leases (as of May 2026) that are not yet on the balance sheet and start as campuses come online. Rent is due once those leases begin, even if customer cash is later. That is why the stock can de-rate on funding even with a full book. The high ratio argues for utilisation if delivery lands. Free cash flow and the lease stack are the separate question of who funds the build before the backlog turns into cash. Other hyperscalers can look weaker on the same ratio because more of their spend serves their own ads and cloud stacks, which never appear as Oracle-style external backlog. Delivery is catching up with that book. Oracle has put about 850 MW and more than 300,000 GPUs into service, with GPU utilisation at 97.9% and renewals at a premium — capacity is being used when it lands. At the Abilene, Texas campus, six of eight buildings are live, and customer acceptance of new clusters has shortened to about 24 hours: delivered capacity is signed and usable in a day, not weeks. The earlier caution still holds: lab tests of how many tokens a cluster actually produces, and real traffic samples through gateways that serve open-weight models, are still thin. Campus delivery looking full is not the same as those checks. Direction still matters. Across the complex, Friday’s snapshot still looks like a build-out, not a hangover. For the 13 names, aggregate AI enterprise value is about USD 10.7 trillion. AI EV over disclosed backlog is in the mid-single digits. AI EV over plan-implied revenue is in the high-single digits on the broader cuts. Planned capacity is still well above 100 GW. Those multiples look attractive if the book converts: a few years of contracted work, and under 10 times the revenue the build plan implies — not a 20-times software multiple on a hope. Financing risk is the other side of the same picture. One debate is a high EV versus invested capital. Another is a high EV versus off-balance-sheet commitments. Oracle now forces both into one name: hyperscaler-scale backlog, a neo-cloud-like equity valuation, and a commitment stack you can inspect in ABBX. Verdict: no broad AI bubble signal. Week 17 of our ongoing weekly series. Updates every Friday. Full interactive dashboard (Fundamentals, Forward Valuation, Expanded Debt & Capex, Capacity) available at Convequity. #AIBubbleBarometer #AIBubble
@tomicki I can't even see what possibly resolves this for many, many years. Could see the big three $MSFT $GOOG $AMZN hit insane market caps.
*MICROSOFT PLANS TO TRIPLE DATA CENTER CAPACITY TO 38 GIGAWATTS $MSFT planning on having more than 38 GW of capacity up in 2032, compared to 12 GW currently. Jeez man we might be early
Open weight model to Nvidia ls kerosene lamp to Standard Oil. Free access to models = more demand for underlying infra. What's better is $NVDA can make this Lamp tailored and optimized for Nvidia stack such that users have to pick: Free model + $NVDA stack or Expensive model + Non-NVDA stack. The question is more about if $NVDA can deliver frontier open weight models or not. I am still a bit skeptical about it because it takes an elite dedicated team to do that and $META learned that hard lesson. And it also requires visionary mgt directly leading the elite team which $GOOG and $MSFT failed, while $SPCX realized it and back up again.
FT: Big tech giants booked a $160B+ windfall last qtr from investments in other AI companies. $GOOG, $AMZN, $NVDA, & $MSFT all had lg boosts to their pre-tax profits from ‘other income’ in theory P&L, due largely to valuation gains on equity stakes in other leading AI companies
The AI build is moves more aggressively off the balance sheet Convequity’s debt scan across $MSFT $AMZN $GOOGL and $META: what these companies borrow in public is rising slowly. What they have promised to spend later — leases not yet started, equipment orders, contracted compute — is rising much faster. In 2Q26 that gap is the widest in four quarters. Off-book commitments are running toward +316% year-on-year. On-book debt is barely moving. If you only watch headline borrowings, you miss the cycle. MSFT is the clearest case. On-book debt +15% YoY. Off-book commitments +138%. That is why its all-in financing load is about 17x reported borrowings. Microsoft is under pressure from two sides: shareholders who want more AI spend, and shareholders who want less capex and faster returns. The compromise is to slow the capex it puts on its own books and lock in capacity from $IREN, $NBIS and other neo-clouds instead. How that works: IREN or NBIS borrows, builds the site and owns the chips. Microsoft signs a multi-year contract to pay for the capacity. Microsoft does not put the building on its balance sheet. It takes a future bill — rent and service payments that show up later as operating cost. Asset risk moves to the neo-cloud. Payment risk stays with Microsoft. GOOGL looks similar on a multiple and is doing something different. All-in commitments are 10.2x borrowings: $100bn of headline debt, $121bn including leases, $902bn off-book. $811bn of that off-book pile is purchase orders for its own stack — TPUs and the kit around them — not rented neo-cloud sites. On-book +190% YoY. Off-book +836%. That multiple is Google buying the factory, not renting it. META is closer to Google than to Microsoft: on-book +127%, off-book +680%. Some of Meta’s orders are reserved compute from CoreWeave and Nebius, which Meta will expense as it uses the capacity. Most of the pile is still Meta committing to build and buy for itself. AMZN is the most balanced of the four (+59% on-book / +80% off-book). Both lines are rising together. If the cycle breaks, Microsoft is less stuck with buildings and chips it owns. It is more stuck with bills it already signed. Google is more exposed because more of the capital is already spoken for on its own account. If compute gets scarcer, the extra megawatts IREN and NBIS have not yet sold can go to whoever pays more. Microsoft then has to wait or pay up. Because it owns less of the physical stack, it has less spare capacity it can simply switch on — which means higher compute costs and tighter margins. Powerful cycle. Not a broad bubble. The heat is in the promises, not the 10-Q debt line. Full AI Bubble Barometer available at Convequity.
 MSFT 2026-08-30
Microsoft’s Azure surpassed $100 billion in annual revenue as growth accelerated to 43%, while AI infrastructure spending compressed cloud…
 Vinay Utham, CFA 2 clicks
Microsoft’s AI data-center buildout lifted annual CapEx from $5.5 billion in FY2014 to $115.9 billion in FY2026, resetting free-cash-flow…
Market already confirming this idea. $GOOG $AMZN $MSFT up since that beat. "Neoclouds" should be big winners too. I prefer to bet on the proven big, scale advantaged operators. But if the neoclouds are much cheaper per unit of compute, they could be the better risk adjusted return.
The $3T “hidden AI debt” number is not the story WSJ just put a headline on the shadow capex we’ve been tracking for a while. Purchase commitments + leases that have not started. Most of it never hits the balance sheet. The $3T is real. The interpretation is not. Add the explicit debt-like items on the books of $GOOGL $MSFT $META $AMZN and you get ~1.69x. Widen the definition to implicit / off-book instruments and it can balloon to 8.36x — approaching that $3T figure. That is the chart. It is not the economics. 1. Most of this is contract value, not a hard legal obligation to pay. A lot of it is pay-as-you-go. The commitments they actually have to fund already sit on the balance sheet. 2. The implicit load is shared. It is spread across financial players — private credit and equity — who are underwriting the build. Their IRRs are not insane. Current ROIC on this spend is still high. This is not a bubble from here. 3. AI ROIC can compress later. I would not be surprised. Near-term it is more likely to stay elevated or even rise. Compute is still short. Efficiency gains are raising, not lowering, the value of each incremental GPU-hour. 4. What the hyperscalers are actually doing: paying a bit more, accepting a slightly lower margin, and sharing a slice of the economics with investors who want the risk. That is risk offload, not hidden leverage. The cleaner setup is still the player that can keep building more capacity internally without leaning as hard on this structure. SpaceX is the extreme version of that. It also means more profit pass-through to the specialized GPU clouds sitting in the middle of this: $IREN $NBIS $CRWV and others. The $3T is a real number. Treating it as imminent balance-sheet stress is the wrong read. Pictures below are snapshots from our AI Bubble Barometer.

Hyperscalers’ off-balance-sheet lease and purchase obligations rose from roughly $1 trillion to $1.5 trillion, turning the AI buildout into…

Steve Eisman argues the AI boom hinges on Anthropic and OpenAI’s importance to hyperscalers, while weighing software, CoreWeave and Cisco…
Microsoft rose 29.6% in under two weeks after Q4 FY26 results, topping $500 as AI-driven CapEx and EBIT growth support its ROIC and…
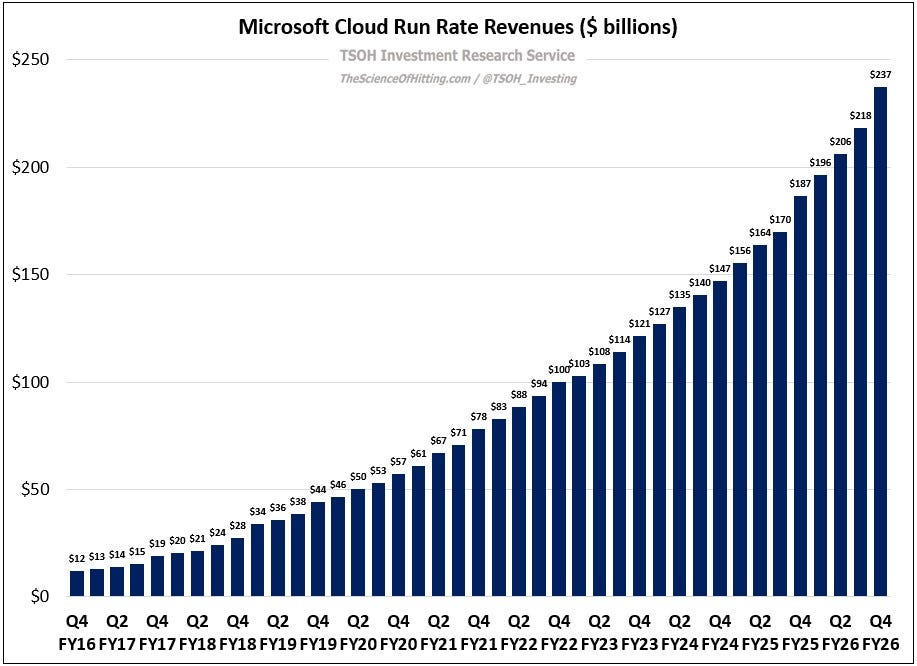
Microsoft’s cloud business grew from a $12 billion FY16 run rate to about $237 billion by FY26, while AI-era CapEx may exceed $200 billion…

Lam Research lifted its September revenue guide above consensus, while Microsoft’s capex cut reflects lease accounting and Meta’s AI…
$MSFT print and call is the best thing that could have happened to the AI infra trade at this panic stage. Solid growth across the board with key KPI acceleration (Azure). At the same time, opex to grow slower than revenues, capex $ down due to accounting change (higher useful life estimate) but actual demand for "compute" up a bunch. Still generating FCF on back of accelerating OCF to over 30%+. AI bulls should be thanking $MSFT rn.
$MSFT is showing us how to have your AI cake and eat it too. Zuck should take notes

Jenga IP’s Q2 2026 investor call covers software research on Microsoft and Intuit, upcoming Adobe coverage, and portfolio changes on July…
Jenga IP’s Q2 2026 investor call covers Microsoft, Intuit and upcoming Adobe research, plus portfolio changes, on July 30.
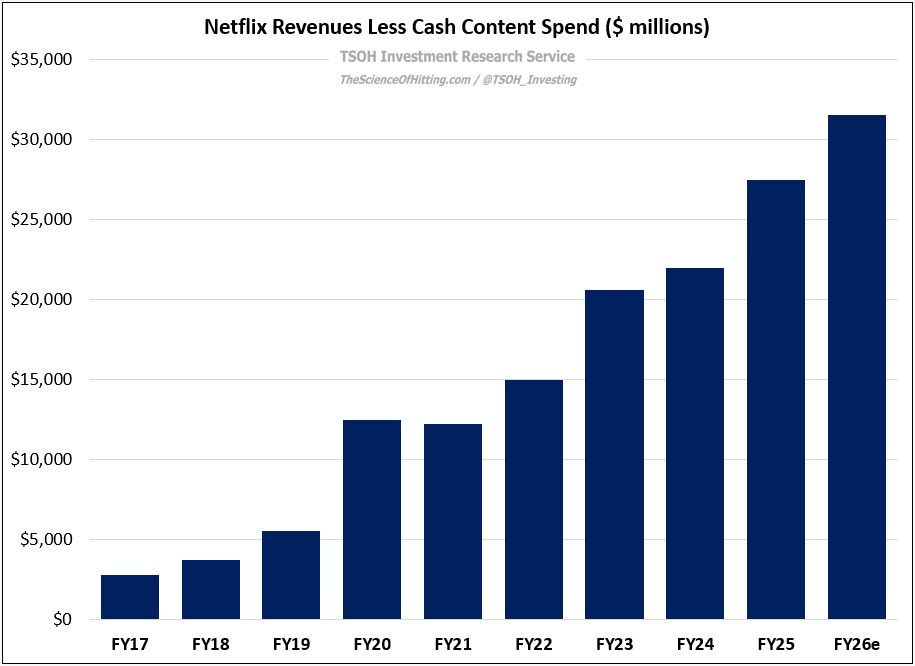
TSOH Weekly Roundup covers the Paramount-Warner court block, Xbox Game Pass’s subscriber shortfall and pricing reset, and Red Bull’s 28%…

Microsoft urges enterprises to keep AI memory, evaluations and orchestration inside their tenant boundary, making frontier models…
Meta and Microsoft are framed as mega-cap opportunities based on business quality and valuation.
Microsoft is framed as an undervalued, durable business whose competitive position is unlikely to be disrupted.
Letters that discuss MSFT.
Companies the stories above are also about, besides MSFT.
